CCRUN Climate Projections for the Philadelphia Region Based on CMIP6 Data
Increased Precipitation
Philadelphia is getting wetter through increased precipitation. Over the past 82 years, annual average precipitation has increased at a rate of 0.82 inches per decade. In the observed record at Philadelphia International Airport, 6 of the 10 wettest years on record have occurred since 1990. While mean annual precipitation levels increased over the past century, year-to-year (and multi-year) variability of precipitation has also become more pronounced. The standard deviation, a measure of variability, increase from 6.1 inches for the 1941 - 1981 period, to 8.3 inches for the 1982 - 2022 period.
Mean annual precipitation is projected to increase 5 to 12 percent by the 2050s and 8 to 16 percent by the 2080s. Of more concern, but harder to predict, the frequency and intensity of precipitation events (such as hurricanes, Nor’easters, cloud bursts, and cyclones) is also increasing, causing more intense pluvial and fluvial flooding. For example, Hurricane Isaias struck Southwest Philadelphia in August 2020, covering large portions of the Eastwick community in upwards of four feet of water in a matter of minutes2. In September 2021, remnants of Hurricane Ida caused unprecedented flooding of the Vine Street Expressway due to the swelling of the Schuylkill River3.
Table 1: CCRUN Precipitation Projections for the Philadelphia Region based on CMIP6. Projections are based on 35 GCMs and 2 SSPs. Shown are the low-estimate (10th percentile), middle range (25th to 75th percentile), and the high-estimate (90th percentile). Baseline data are for the 1981 to 2010 and are from the NOAA National Climatic Data Center (NCDC)
| Decade |
Low Estimate (10th Percentile) |
Middle Range (25th to 75th Percentile) |
High Estimate (90th Percentile) |
|---|---|---|---|
| 2030s |
0 percent |
+2 percent to +8 percent |
+10 percent |
| 2040s |
+1 percent |
+4 percent to +10 percent |
+13 percent |
| 2050s |
+2 percent |
+5 percent to +12 percent |
+14 percent |
| 2060s |
+2 percent |
+5 percent to +13 percent |
+17 percent |
| 2070s |
+3 percent |
+7 percent to +14 percent |
+18 percent |
| 2080s |
+3 percent |
+8 percent to +16 percent |
+21 percent |
| 2100 |
-2 percent |
+6 percent to +22 percent |
+30 percent |
2WHYY, “Isaias emergency: Eastwick residents call for city, state aid after ‘devastating’ flooding”. whyy.org/articles/isaias-emergency-eastwick-residents-call-for-city-state-aid-after-devastating-flooding/
3WHYY, “Why Ida’s remnants left the Vine Street Expressway under water”. whyy.org/articles/hurricane-ida-flooding-vine-street-expressway-infrastructure/
Rising River and Sea Level
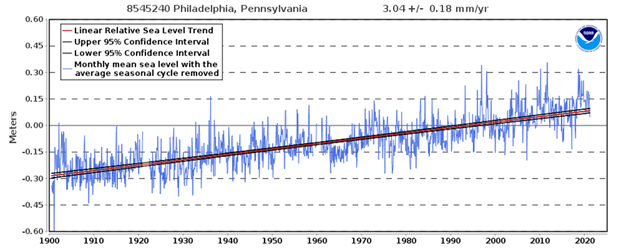
River and sea levels are rising. Observations indicate that the tidal Delaware River rose at the rate of about 1.2 inches (0.3 meters) per decade over the last century (Figure 2). Sea level is projected to rise in Philadelphia by 7 to 11 inches by the 2030s, 14 to 19 inches by the 2050s, and 24 to 38 inches by the 2080s. The high-end estimate for sea level rise by the 2080s is 45 inches. By 2100, sea levels are projected to rise by as much as 64 inches. Sea level rise alone is increasing the number of days that Philadelphia experiences high tide—or sunny day--flooding (flooding due to tide levels in the absence of a storm). Coupled with storm surges, sea level rise is causing an increased frequency of coastal flooding, which is exacerbated further when accompanied by heavy precipitation events. As the sea level in the Delaware River Estuary continues to rise, it will also push salty and brackish water upriver causing impacts to ecosystems and water treatment facilities designed to only accommodate fresh water.
Figure 2: Source National Oceanic and Atmospheric Administration, Tides and Currents
Table 2: CCRUN Sea Level Rise Projections for the Philadelphia Region based on CMIP6 Projections for future sea level rise are derived from the IPCC's 6th Assessment Report. Projections are relative to the 1995 to 2014 based period. See et Fox-Kemper al., 2021 for a full description of the methods.
Decade 10th Percentile 25th Percentile 50th Percentile 75th Percentile 90th Percentile
| Decade | 10th Percentile | 25th Percentile | 50th Percentile | 75th Percentile | 90th Percentile |
|---|---|---|---|---|---|
| 2030s |
6 in. | 7 in. | 9 in. | 11 in. | 13 in. |
| 2050s |
12 in. | 14 in. | 16 in. | 19 in. | 23 in. |
| 2080s |
21 in. | 24 in. | 29 in. | 38 in. | 45 in. |
| 2100 |
25 in. | 29 in. | 36 in. | 50 in. | 64 in. |
| 2150 |
38 in. | 47 in. | 58 in. | 88 in. | 177 in. |
Increased Air Temperature
Philadelphia is also getting hotter. Over the past 82 years, annual average temperature has increased at a rate of 0.43 °F per decade. In the observed record at Philadelphia International Airport, 8 of the 10 hottest years on record have occurred since 2000.
Looking at extreme events, 7 of the 10 years with the most days at or above 90 degrees in the 83-year record have occurred since 1990. However, it is important to note that the number of events in any given year is highly variable and the long-term trends (1941 to present) for these heat events cannot be distinguished statistically from random variability.
In the near future, mean annual temperatures are projected to increase by 4.1 to 5.8 degrees F by the 2050s and by 5.5 to 9.4 by the 2080s. In addition to mean temperatures increasing, the frequency and intensity of hot days and heat waves is also projected to increase. By the 2050s, the numbers of days with maximum temperatures at or above 95 F (currently experienced on average 6 days per year) is projected to range from 21 to 34 days per year and by the 2080s, 34 to 72 days per year. The frequency of heat waves, defined as three or more consecutive days with maximum temperatures at or above 90 °F, may triple by the end of the century, from 3 events per year in the current climate to 9 events per year in the future.
Table 3: CCRUN Air Temperature Projections for the Philadelphia Region based on CMIP6. Projections are based on 35GCMs and 2 SSPs. Shown are the low-estimate (10th percentile), middle range (25th to 75th percentile), and the high-estimate (90th percentile). Baseline data are for the 1981 to 2010 base period and are from the NOAA National Climatic Data Center (NCDC).
| Decade |
Low Estimate (10th Percentile) |
Middle Range (25th to 75th Percentile) |
High Estimate (90th Percentile) |
|---|---|---|---|
| 2030s |
+1.9°F | +2.7°F to +3.9°F | +4.7°F |
| 2040s |
+2.6°F | +3.3°F to +4.9°F | +5.9°F |
| 2050s |
+3.0°F | +4.1°F to +5.8°F | +6.8°F |
| 2060s |
+3.6°F | +4.7°F to +6.9°F | +8.5°F |
| 2070s |
+4.0°F | +5.3°F to +8.0°F | +9.8°F |
| 2080s |
+4.7°F | +5.5°F to +9.4°F | +11.1°F |
| 2100 |
+4.9°F | +6.0°F to +10.5°F | +12.9°F |
Table 4: CCRUN Climate Projections for the Philadelphia Region based on CMIP6. Projections are based on 16GCMs and 2 SSPs. Baseline data are for the 1981 to 2010 base period and are from the NOAA National Climatic Data Center (NCDC). Shown are the low-estimate (10th percentile), middle range (25th to 75th percentile), and high-estimate (90th percentile) 30-year mean values from model-based outcomes. Decimal places are shown for values less than 1, although this does not indicate higher precision/certainty.
| Extreme Event | Baseline | 2030s | 2050s | 2080s |
|---|---|---|---|---|
|
# of days/year with maximum temperature at or above: |
27 6 |
37 (47 to 56) 67 11 (17 to 21) 27 |
43 (56 to 72) 84 17 (21 to 34) 51 |
63 (72 to 102) 117 27 (34 to 72) 88 |
| # of heat waves/year Average length of heat waves (in days) |
3 5 |
5 (5 to 6) 5 (6 to 7) 8 |
6 (7 to 9) 9 9 (9 to 9) 9 |
5 (6 to 7) 9 6 (7 to 10) 12 |
| # of days/year with minimum temperature at or below 32°F | 84 | 45 (57 to 70) 70 | 23 (45 to 63) 63 | 2 (10 to 50) 57 |
| # of days per year with rainfall exceeding 1 inch 2 inches 4 inches |
11 2 0.2 |
10 (11 to 12) 12 2 (2 to 2) 3 0.2 (0.2 to 0.2) 0.2 |
11 (11 to 13) 13 2 (2 to 3) 3 0.2 (0.2 to 0.3) 0.3 |
11 (12 to 14) 14 2 (2 to 3) 4 0.2 (0.2 to 0.3) 0.3 |