Safety by numbers, empirical evidence in Bogotá
Posted on
July 23, 2020
By: Dario Hidalgo
Promoter, Researcher and Practitioner of Sustainable Mobility
Lea la versión en español, publicada en La Silla Llena, aquí.
The capital of Colombia has progressed in road safety over the last years, but bike deaths kept increasing. A new study by SALURBAL members, shows interesting evidence. Use has increased much rapidly than cycling fatalities, but there is still plenty to do, particularly for women.
Bike fatalities have doubled in Bogotá since 2012, as well as their participation in total road traffic deaths. During the same period, total number of fatalities has reduced from 570 per year to 523, mainly pedestrians (Data ONSV ANSV).

A significant contributor to the increase in traffic fatalities has been exposure. According to the SALURBAL study “Bicycle safety in Bogotá: A seven-year analysis of bicyclists’ collisions and fatalities”, between 2011 and 2017 bike population tripled, but crashes with victims only increased 40%. The authors make a very detailed estimation of the cycling population and the distance traveled using several open source data and calculate the crash and fatalities rates. They find that the crash rate per biker declined 55% and 70% per kilometer biked. They also find that the fatality rate declined 46% per biker and 64% per kilometer biked.
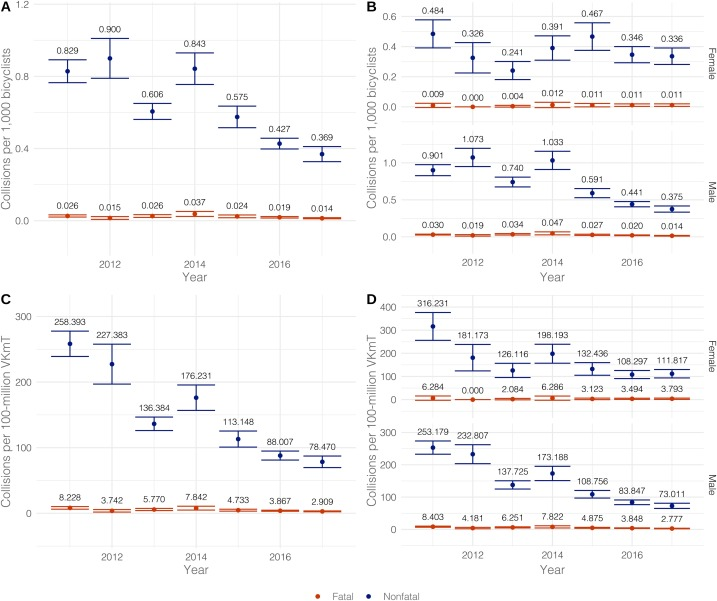
- Monthly crash rate and fatality rate per 1,000 bicyclists
- Monthly crash rate and fatality rate per 1,000 bicyclists for male and female
- Monthly crash rate and fatality rate per 100 million kilometers bicycling
- Monthly crash rate and fatality rate per 100 million kilometers bicycling for male and female
The data reflect some differences between female and male bikers. The crash rate per biker reduced 30% for females and 58% for male, and fatalities per biker reduced 53% for male, but there was no evidence of significant reduction for females.
These reductions in rates, follow a phenomenon called “safety by numbers”, observed in high income countries. In these countries the crash rates per biker have reduced between 30% and 68% in a 24 year period (Buheler & Pucher, 2017), while Bogotá only took seven years to achieve a a 55% reduction. The authors hypothesize that this could be the result of different departure points; while the fatality rate per 100 million kilometers was 4.7 in USA at the beginning and 1.3 in Germany, in Bogotá it was 8.2 in 2011.
The SALUBRAL research team performs three additional types of analyses on the biker’s traffic safety: a spatial analysis to identify areas with the larger number of incidents; a statistical analysis to identify factors that change the crash probabilities, and a revision if these factors have liner impacts or not.
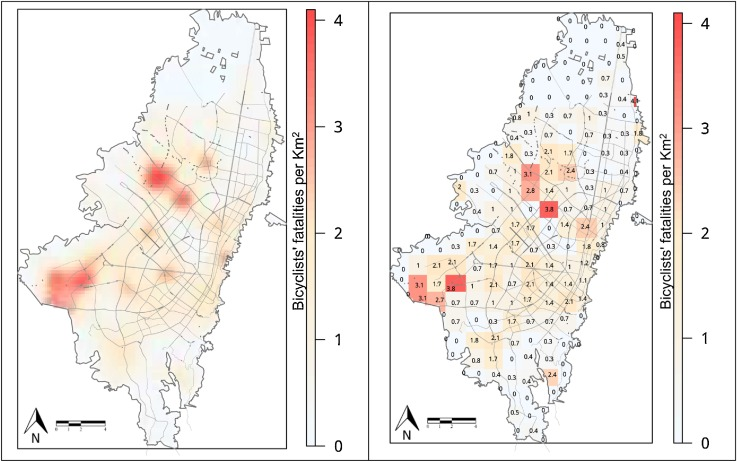
The spatial analysis, shows higher concentration of bike fatalities in areas in the south west and west parts of the city, with very similar results than a 2017 special report on bicycles by Bogotá Como Vamos (spatial analysis by Juan David García). Areas with higher density of biker´s traffic fatalities have less segregated bike lanes, higher participation of trucks and buses, and are mainly middle- and low-income areas. Both the SALURBAL study and the Bogotá Como Vamos report suggest expanding dedicated infrastructure in these areas, and increase safety awareness for all road users, and continue programs for speed management under Vision Zero Bogota, program.
Bicyclists’ fatalities in traffic crashes according to vehicle type in Bogotá, January-December 2016 (preliminary data)

Source: Juan David García, in Special Report on Bicycles in Bogotá, 2017, Bogotá Cómo Vamos
The statistical analysis of factors affecting biker´s road safety, shows that the crash likelihood with trucks and buses is greater than with automobiles for women, and, in the case of males, crashes with motorcycles are less likely than with automobiles. In general, larger vehicles (trucks and buses), increase the likelihood of crashes as compared with automobiles. In the non-linear analysis fatal collisions are associated with slope, with a 2.5% threshold for women and 3% for men, and also with the type of surface (roads with poor maintenance entail higher risks), time of occurrence (higher probability between 22:00 and 4:00). Additional factors with a balanced sample show additional effects of road width (wide roads have higher risk), traffic speed (higher speed higher risk), number of lanes (more lanes, more risk) and number of bikers (higher exposure, more fatalities).
The authors highlight the role of expanding infrastructure at the begining of last decade in increased number of bicyclists in the city, as well as activism since 2012, citing Rosas-Satizábal y Rodríguez-Valencia (2019). Commentators in Bogotá indicate that bad quality of public transport may be an important factor as well.
The SALURBAL team makes important recommendations for public policy with gender perspective. Building protected bike lanes tops their list, specially by separating bikers from heavy duty vehicles. They also encourage speed reductions, especially on arterials. The two activities have continued over the last three years. They also suggest joint work of the planning, mobility and women´s departments, using tools like SAFETYPIN to identify unsafe sports.
What is going on in 2019 and 2020?
The Mobility Survey 2019 shows that 212,660 (24.2%) women bike trips and 667,708 (75.8%) men bike trips (Total 880,367 +/- 7,100). These trips are made by approximately 415,267 people (with 2.12 trips per person).
In 2019, we had 11 female cyclist fatalities and 55 male cyclists (16.7% female, 83.3% male). Participation in fatalities was less than the participation in total bike trips, indicating more careful attitudes by women. Regarding rates, we had 0.013 monthly fatalities per 1,000 bicyclists, compared with 0.014 in 2017. The rate keeps declining, but at a lesser pace than the previous years. One emerging phenomenon is the increase in deliveries, which may contribute, eventually, to this change in pace. Rate for women is estimated in 0.009 monthly traffic deaths per 1,000 bicyclists in 2019, compared to 0.011 in 2017. For male, the rate kept stable between 2017 and 2019 at 0.014 monthly deaths per 1,000 bicyclists. It would be interesting to see if the rates have changed with the number of kilometers biked.
In 2020, decline in activity resulting from Covid-19 lock-down, has resulted in a 31% reduction in total fatalities between January and May 2020 compared with the same period of 2019. But this reduction has not been reflected in bike fatalities. In 2019 the number of fatalities was 25 (7 females, 18 males), this year 24 deaths, all male. Bike counts on temporary bike lanes have shown an increase in bicycling, but reduction in activity has also increased motor vehicle speeds, particularly at night.
The SALURBAL study shows as that Bogotá has followed the international safety by numbers trend, but that there is still a lot to do to reduce fatalities and injuries for the growing number of bicyclists in our city. Preliminary estimation of rates for 2019 indicates that the pace of reduction in rates may not be the same than before 2017, and the fatalities in 2020 indicated stability in bike deaths despite activity reduction due to Covid-19, Bogotá faces a big challenge to meet its goal of reducing fatalities by 20% in 2024 compared to 2019; following the recommendations by SALURBAL researchers may help in achieving this goal.