Introducing the Small Business Equity Toolkit
Below is the Nowak Metro Finance Lab Newsletter shared biweekly by Bruce Katz.
Sign up to receive these updates.
March 25, 2021

(co-authored with Victoria Orozco, Colin Higgins, and Aaron Thomas)
The COVID-19 crisis is America’s greatest economic shock since the Great Depression. It’s landing hardest on small businesses, the heart of local economies and community life. The pandemic has revealed not only the fragility of many of these enterprises but also the profound racial, ethnic, and gender disparities in how they are supported by federal policies, private practices, and local actions.
This social upheaval from the pandemic has also sharpened our focus. Over the past several months, the Nowak Metro Finance Lab at Drexel University has partnered with Accelerator for America and The Mastercard Center for Inclusive Growth to develop the Small Business Equity Toolkit.
The new Toolkit, comprising a Small Business Equity Tool (SBET) and National Inclusive Metro Recovery Playbook, highlights the tremendous economic opportunity to grow businesses owned by Black, Hispanic, Asian, and women entrepreneurs to accelerate an inclusive recovery. It also facilitates the sharing of best practices to guide local and regional officials in supporting the growth of Minority and Women Business Enterprises (MWBEs) to close the racial, ethic, and gender wealth gaps that persist in America.
The Small Business Equity Tool (SBET)
Maintaining real-time information on the number, size and sector of small businesses in general and MWBEs in particular is vital to prioritize actions, target efforts, and set goals. Local “scorecards” using this data will help communities set reasonable targets for recovery from COVID-19 and measure progress against ambitious targets for small business creation.
The Small Business Equity Tool captures and ranks the performance of businesses owned by minorities and women to promote a clearer understanding of the small business ecosystem and its gaps, encourage goal setting and provide useful comparison points to economic decision-makers at all levels.

The Tool also provides groups of comparison peer cities based on city demographic and economic characteristics. With these peers, local decision makers can easily obtain meaningful comparison points for the local performance of businesses owned by minority and women entrepreneurs.
A New Approach
The Tool incorporates a Business Index to rank the performance of Black-, Asian-, Latino-, and Women-owned employer businesses across metropolitan areas and cities in the U.S. The Index reveals the fundamentals of the small business economy prior to the Coronavirus pandemic across three dimensions: number (business density), size (average annual sales), and sector of businesses (number of businesses in high-wage sectors). The small business sector has generally focused only on one of these dimensions — the number of MWBEs. We need a broader approach for measuring disparities in the business ecosystem and actionable metrics.
-
Number: A business density metric that shows the number of employer businesses per 1,000 residents of the selected demographic group. A higher ratio of firms to residents relates to more wealth-building opportunities and employment for workers from the same group. Focusing on Business Density instead of just the number of MWBEs also accounts for the size of the minority population in an area.
-
Size: The average annual sales from employer businesses. The larger the annual average sales of such businesses, the greater their economic relevance and impact. In the U.S., the average minority-owned business generates 40% less sales than a non-minority business. Sales are associated with the scale of the business, the employment that it generates, and its resilience to shocks. An inclusive ecosystem needs to track and target this dimension.
-
Sector: The percentage of employer businesses operating in high-wage industries [1]. Healthier entrepreneurial ecosystems tend to have a higher percentage of businesses operating in markets that yield higher sales and offer better wages. In the U.S., the participation of businesses owned by minorities in low-wage industries is 14 percentage points higher than for white, non-Hispanic-owned businesses. Each population group is also concentrated in a particular sector. We need a sectoral approach to build our economies back better.
Each of these three dimensions include absolute and relative metrics. Both types of metrics are needed to understand the state and the challenges faced by MWBEs. Absolute metrics are the numerical values of the different variables. They allow us to assess businesses’ performance in the selected group, regardless of the performance of businesses owned by other population groups in the same area. These absolute metrics partly capture the area’s dynamism and competitiveness [2]. By contrast, relative metrics assess the performance of businesses owned by the selected population group compared to the performance of their comparison groups [3]. These relative metrics account for local conditions that could have similar effects in both groups and consider the size of the gap between businesses owned by different populations. An inclusive recovery demands a focus on both metrics.
How it Works
The Tool displays — and allows users to compare — the performance of Black-, Asian-, Latino-, and Women-owned employer firms in the country’s 100 largest metropolitan areas and cities.
-
Where? You can choose the geographic level: metropolitan statistical areas or cities. The Tool provides data for America’s largest 100 metros and largest 100 cities in addition to five selected partner cities.
-
Who? You can choose the population of interest: Black, Asian, Hispanic, Minority [4] or Women. Statistics displayed will assess the performance of employer businesses owned by the selected population group. You can also use filters to customize your selection, such as identifying similarly sized populations to compare and metros or cities with like-non-white populations.
-
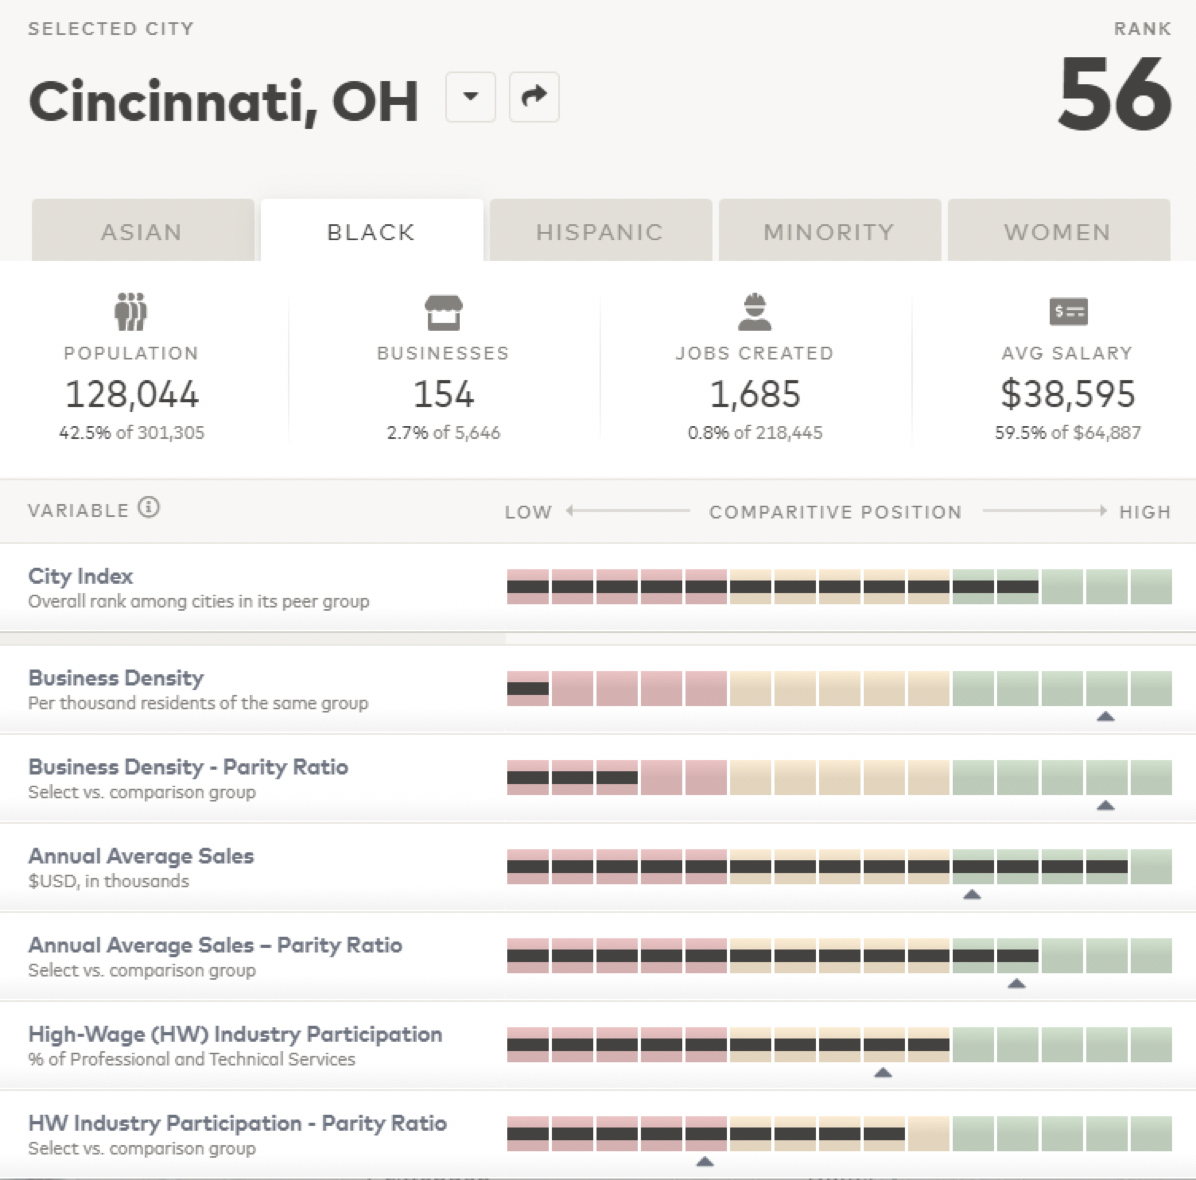
What? You can select the metric that you want to display, choosing between the Business Index and the six metrics that make it up: Business Density, the Parity Ratio for Business Density, Average Sales, the Parity Ratio for Averages Sales, Participation in High-Wage (HW) Industries, and the Parity Ratio for Participation in HW Industries.
The Small Business Equity Tool provides key insights on:
-
The comparison of the business performance across areas. For the selected metric, the Tool displays which places are performing better and which are performing worse. For city-level analysis, it also generates a default group of 15 peer cities that are similar in their economic and demographic characteristics to provide users with useful comparison points.
-
The characterization of employer businesses in an area. If you click on your geographic area of interest on the map, you will see additional statistics on the number, size, and sector of Black-, Latino-, Asian-, and women-owned employer businesses in the area.
-
The comparison of business performance within areas. When you click on your area of interest, you will be able to see key statistics for businesses owned by the selected population group, including how this group performs relative to a comparison group. For example: if you select Black-owned businesses in a city, the Tool also provides statistics for white-owned businesses in the city to easily contextualize and assess the size of gaps within the selected place.
Recovery Playbook
The National Inclusive Metro Recovery Playbook offers mayors, business and civic leaders, and other local leaders a roadmap for growing businesses owned by minorities and women in the post-COVID economic recovery. They are guides to inform local strategy and prioritize development.

The playbooks provide a snapshot of where we were as a country prior to the pandemic, measure the economic opportunity of an inclusive recovery, and highlight best practices from cities across the country that are pioneering approaches to strengthen key dimensions of their Black-, Asian-, Women- and Latino-owned business ecosystems, including supplier diversity, financial and business services, licensing and regulation, commercial corridor development, and sector diversification.
The Playbook also presents the 18-month Stimulus Command Centers that serve as executive-level task forces comprising leaders from the public, private, and civic sectors. As we recently wrote, there will be two, if not more, phases to federal action, and the complicated operations of effectively, efficiently, and equitably distributing federal investments will be central to the speed of recovery in 2021. Focused city, regional, county, and state networks will be essential for distributing this federal relief and recovery funding. The goal of the Stimulus Command Centers is to plan for, prioritize, and coordinate federal relief and recovery investments.
Our hope is to make the Small Business Equity Toolkit a living resource that can be updated to address changing economic circumstances as we move from rescue to recovery. The team at Drexel University’s Nowak Metro Finance Lab continues, for example, to collect and analyze more granular information about the sectoral structure of the leading metropolitan areas in the United States. In the end, building back better requires both thinking differently about our small business economy and doing things differently to drive inclusive outcomes. We hope you find this toolkit helpful and actionable in this important journey.
[1] As a proxy for high-wage industry we consider the percentage of employer businesses in the Professional and Technical Services sector. Our decision is explained by two factors. First, this industry ranks 3rd in terms of average wages in the U.S. Second, among the top high-wage industries, data availability and accuracy by sector and race/ethnic/gender of the owner is significantly higher for the Professional and Technical Services sector than for the Information sector and the Finance sector –the other 2 top high-wage industries. When possible, we suggest calculating the participation of MWBE in low-wage industries too: Health Care and Social Assistance, Accommodation and Food Services, and Administrative and Support. We avoid providing that data in our Tool because of the high number of missing values for these industries in some areas of the U.S.
[2] For example, regional economic activity can boost or constrain the economic environment for forming and maintaining a successful business, regardless of the demographics of business owners. A stagnant economy, for example, would negatively affect the performance of both minority- and non-minority-owned businesses.
[3] See groups and their comparison groups in the Small Business Equity Tool Methodology.
[4] “Minority-owned businesses” are a defined U.S. Census Bureau category that includes businesses owned by populations identified with any race and ethnicity combination other than non-Hispanic White.
Bruce Katz is the Founding Director of the Nowak Metro Finance Lab at Drexel University. Victoria Orozco and Colin Higgins are Senior Research Fellows at the Nowak Metro Finance Lab. Aaron Thomas is Chief Executive Director of Accelerator for America.