Philadelphia Hardship Data
2016
From 2005 to December 2016, the Children's HealthWatch team completed interviews with over 10,000 caregivers of young children under the age of three at St. Christopher's Hospital for Children in North Philadelphia. In this section, we provide a breakdown of the demographic, food insecurity and other hardship data that the Children's HealthWatch team collected during this period.
Household Food Insecurity in the United States
The USDA defines food insecurity as the lack of consistent access to sufficient healthy food for all family members to enjoy active, healthy lives. In 2016, 41.2 million people in the United States, including 12.9 million children, lived in food insecure households. This represents nearly 13% of all households and more than 17% of all children in the country. Nearly 19% of young children under age 6 (or 6.7 million) lived in households experiencing food insecurity in 2016.
Food Insecurity in Philadelphia
Children's HealthWatch research has shown that young children who live in households experiencing food insecurity are more likely to:
- Be in poor or fair health
- Experience problems with cognitive development
- Exhibit behavioral and emotional problems
We measured household food insecurity using the 18-question USDA Food Security Scale. Based on an adult's answers to this survey, households are categorized as having:
- Household food security - answering 'yes' to 2 or less questions
- Household low food security - answering 'yes' to 3-5 questions
- Household very low food security - answering 'yes' to 6 or more questions
For more information about the impact of food insecurity, see these Children's HealthWatch publications:
Over 1 in 4 Children's HealthWatch Philadelphia families reported household food insecurity in 2016 (22%).
Food Insecurity Among Children
Food insecurity among children occurs when the children (0 to 18 years old) who live in a household are not getting enough food to live a healthy, active lifestyle. Child food security is especially important because it not only affects the children's current health, but also their lifelong well-being and development.
It is measured using the responses of an adult caregiver in the household to a subset of 8 items from the 18-item USDA Food Security Scale. Based on an adult's answers to this survey, households are categorized as having:
- Food security among children - answering 'yes' to 0 or 1 question
- Low food security among children - answering 'yes' to 2-4 questions
- Very low food security among children - answering 'yes' to 5 or more questions
For more information about the impact of child food insecurity, see these Children's HealthWatch publications:
1 in 8 families also reported food insecurity among children in 2016 (12%).
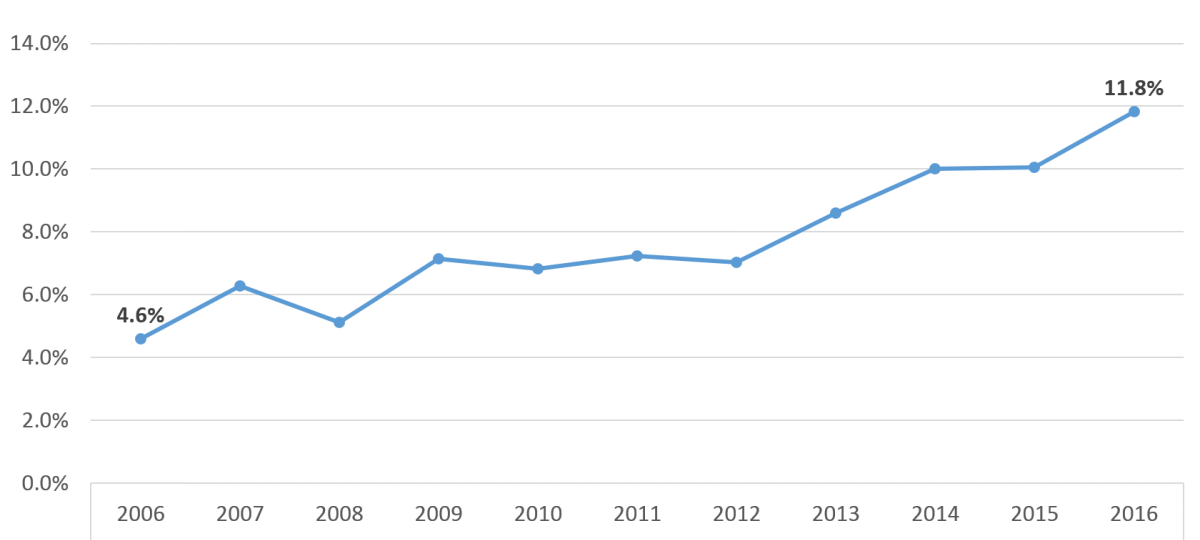
Trends in Household and Child Food Insecurity
Since 2006, both household and child food insecurity have been increasing among families we interviewed in Philadelphia.
For Children's HeatlhWatch Philadelphia families, household food insecurity has been rising over the last 10 years (22%).
Child food insecurity has nearly tripled between 2006 and 2016 (4.6% to 11.8%)
Energy Insecurity
Energy insecurity occurs when families lack consistent access to sufficient home heating or electricity to ensure healthy and safe conditions in the home. Based on caregivers' answers to a series of 4 questions, their household was classified as having:
- No energy problems
- Energy insecurity, which includes:
- Moderate energy insecurity, when the utility company has sent a letter threatening to shut off services in the past 12 months.
- Severe energy insecurity, when the utility company has shut off services, when a family's home has been unheated or uncooled for at least one day, or when the family has used a cooking stove to heat the house in the past 12 months.
Young children who live in households experiencing energy insecurity are more likely to:
- Be in poor or fair health
- Have been hospitalized since birth
- Be at risk for developmental delays
- Experience food insecurity
- Have moved two or more times in the past year
For more information about the impact of energy insecurity, see these Children's HealthWatch publications:
Almost 1 in 3 families were energy insecure in 2016 (27%).
Housing Insecurity
Housing insecurity occurs when families move frequently, crowd into living spaces that are too small, or double up with another family for financial reasons. Based on caregivers' answers to a series of questions, their household was classified as having:
- Stable housing
- Housing insecurity, which includes:
- Moderate housing insecurity, when there are more than 2 people per bedroom in the house or when the family is living with others because they are having financial difficulties.
- Severe housing insecurity, when a family has moved more than once in the past year.
Nearly 40% of families that the Children's HealthWatch team interviewed in Philadelphia experienced some form of housing insecurity. Children's HealthWatch research has shown that children living in a crowded home are more likely to live in households experiencing food insecurity. Children living in families who have moved multiple times in the past year are more likely to:
- Be in fair or poor health
- Be at risk for developmental delay
- Have lower weight-for-age
Over 1 in 3 families reported housing insecurity in 2016 (37%).
Ethnicity of Caregivers
Hunger and poverty affects everyone regardless of any demographic characteristics. The Children's HealthWatch team interviews a racially diverse population in the emergency department at St. Christopher's Hospital for Children.
Race and Ethnicity of Children's HealthWatch Participants
- Hispanic/Latino - 48%
- Black, non-Hispanic/Latino - 37%
- White, non-Hispanic/Latino - 12%
- Biracial, Multiracial, Asian, Native American - 3%