Patterns of Obesity and Cutting Meals in Philadelphia

Data Brief
May 2018
While individual diet and physical activity behaviors impact obesity, community and institutional settings may shape behaviors and precursors of obesity. Food insecurity, the uncertain ability to acquire sufficient and nutritious foods in socially acceptable ways, may at first seem counter to obesity — a disease often characterized by an excess of food. However, these two issues often coexist. Most importantly, food insecurity disproportionately affects those at the highest risk for obesity, including low-income households, women, and members of racial and ethnic minority groups.
Regardless of mechanisms, epidemic levels of obesity and the harmful impacts of both obesity and food insecurity prompt action to identify and explore burden in populations. This brief explores spatial, temporal, and population patterns of cutting meals among those who are obese. We hope this work enables the recognition of these coexisting problems and facilitates discussions of opportunities for intervention.
This brief report provides highlights from eleven behavioral health indicators from seven different sources. Data for this report are the most recent available, mostly from 2015 or 2016. In this report we divided our findings into two categories reflecting behavioral health conditions/symptoms first, followed by information on service utilization and provision.
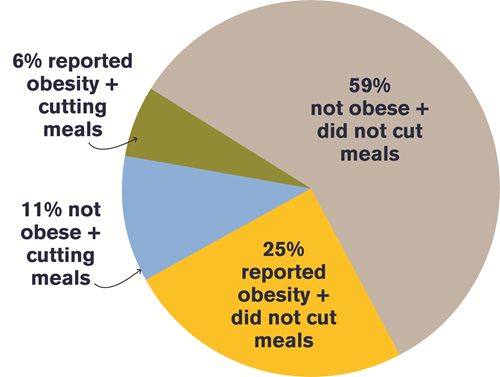
In Philadelphia, 23 percent of those who are obese report either cutting the size of or skipping a meal because there was not enough money in the budget for food.
Key Pathways
Figure 1 illustrates complex pathways linking obesity and food insecurity. Being food insecure can negatively impact mental health, creating stress, anxiety and depression. Pathways that link obesity and food insecurity exist at multiple levels:
- Economic position can influence level of food insecurity through financial constraints.
- Social and economic policies impact food pricing, availability and social acceptability.
- Healthy food environments provide access to healthy choices at home, school, work sites, and restaurants, influencing food insecurity.
- Food environments are linked to economic food choices – unhealthy foods are less expensive compared with healthy foods.
- Financial and emotional pressures of food insecurity increase chronic stress, subsequently promoting obesity through changes in appetite, dietary preference and stress-induced metabolic hormones.
Figure 1, “Pathways that link obesity and food insecurity”
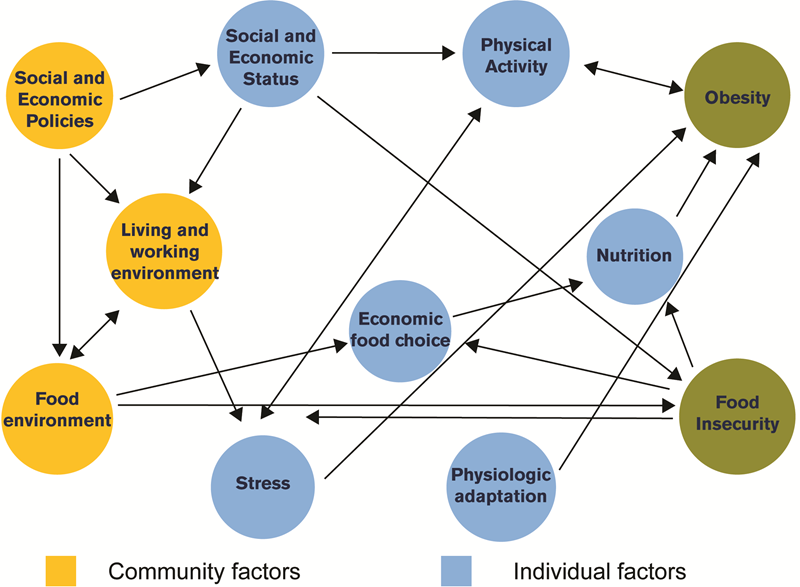
Figure 2, Pie Chart of “Burden of obesity and meal cutting in Philadelphia between 2008 - 2012”
Measurement of Food Insecurity
The Core Food Security questions include, among others, questions about food running out, and questions about cutting or skipping meals because there was not enough money for food. Screening in a clinical setting can be done by asking patients to what extent they agree with two statements:
1. “We worried whether our food would run out before we got money to buy more.”
2. “The food that we bought just didn’t last, and we didn’t have money to get more.”
Data in this brief are from the Southeastern Pennsylvania Household Health Survey (SPHHS) administered by the Public Health Management Corporation (PHMC). This brief uses the question on cutting the size of or skipping a meal because it was the sole measure included in the SPHHS across multiple years.
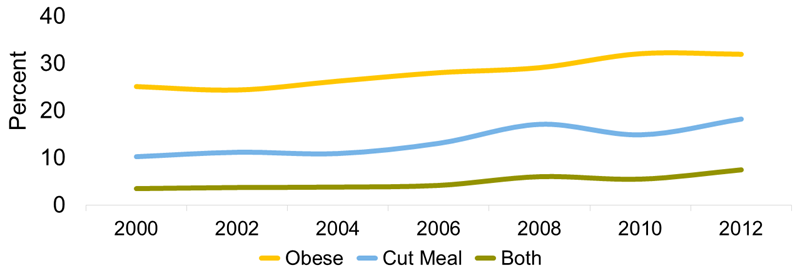
Figure 3, “Philadelphians reporting obesity and cutting meals over time”
Who Reports Both Obesity and Cutting Meals?
Figure 4, “Characteristics of Philadelphians by obesity and cut meal status PHMC 2008 - 2012”
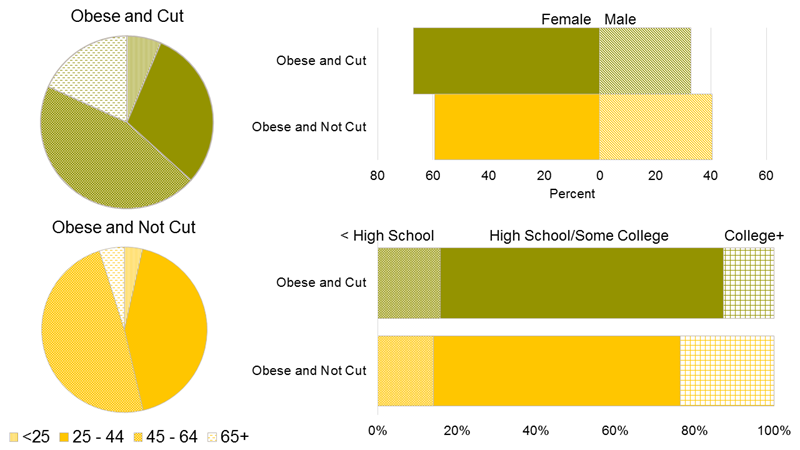
Philadelphians who report obesity and cutting a meal are more likely to identify as female. They are also more likely to be middle age, less educated and poor (Figure 4). Among those who report obesity, the proportion of persons of Hispanic origin was higher among those who cut meals than among those who don’t (20 percent and 11 percent respectively).
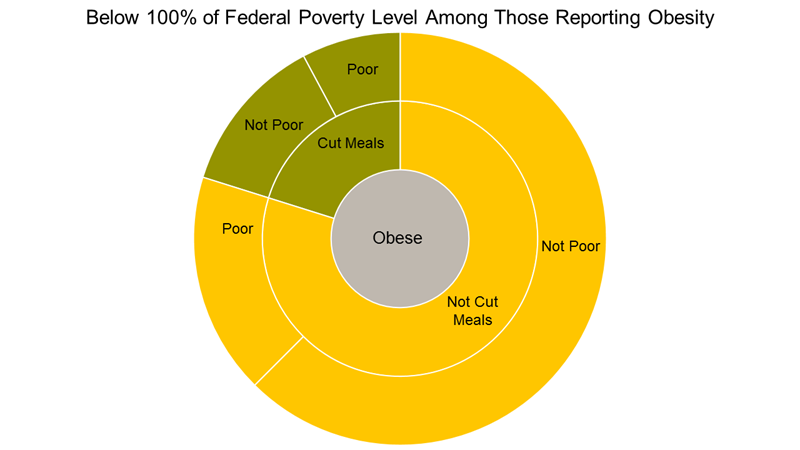
Obesity and food insecurity are patterned by economic disadvantage. More than 22 percent of Philadelphians are poor (below 100 percent of the Federal poverty level). Among those who are obese and report cutting meals, 38 percent are poor (Figure 5).
Figure 5, “Distribution of obese persons by poverty status and whether they report cutting meals”
The Next Generation
While only four percent of those who are obese and cut meals were under age 25, children are impacted by being in households burdened by these characteristics. Of those who were obese and reported cutting a meal, 44 percent had at least one child, and 15 percent had three or more children. Programs like the Women, Infants and Children (WIC) subsidy provide specific foods including whole grains, fruits and vegetables, and reduced fat milk to reduce the impact of food insecurity on obesity. However, only 11 percent of those who were obese and cut meals reported getting a WIC subsidy.
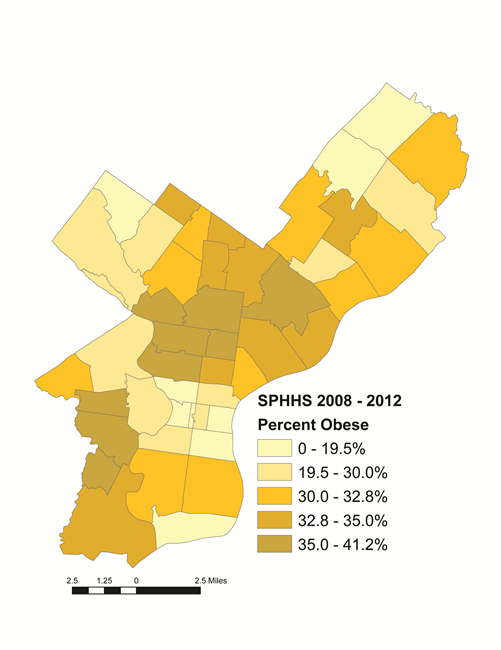
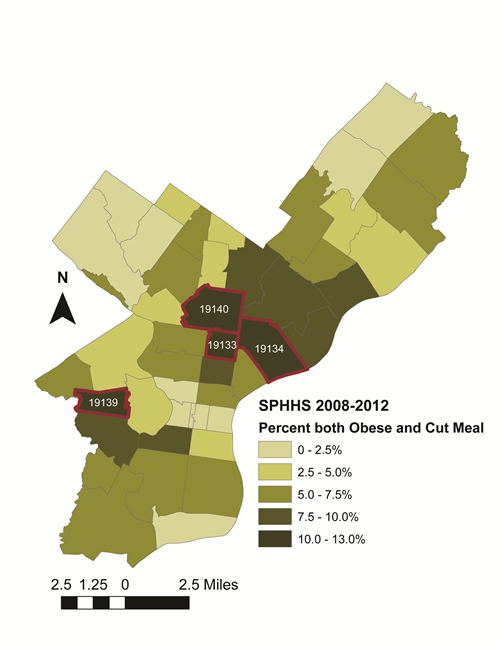
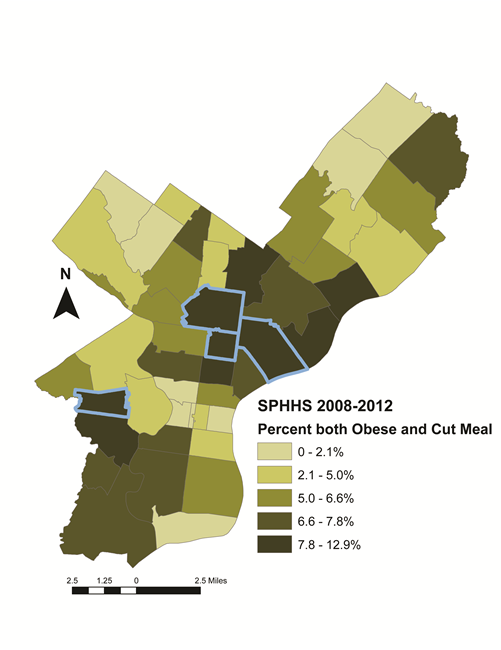
Which Philadelphia Neighborhoods Are Impacted?
The maps below show ZIP codes with high obesity prevalence overlap with ZIP codes containing high numbers of people cutting meals. The greatest burden of obesity and cutting meals also occurs in ZIP codes with high poverty rates and large non-white populations (data not shown)(Parts of North Philadelphia and West Philadelphia, Port Richmond).
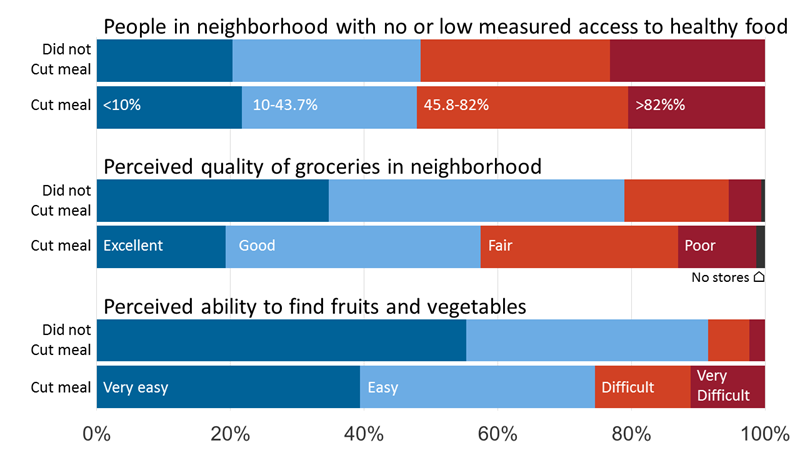
Lower Perceived Access to Healthy Foods
As seen in Figure 6, obese persons who reported cutting and not cutting meals lived in neighborhoods with similar access to objectively measured healthy foods. However, those who cut meals reported worse perceived access to quality groceries and fruits and vegetables than those who did not cut meals. This discrepancy may be due to lower quality and diversity of healthy foods sold at food retailers in lower income areas.
It is important to remember that neighborhood food environment does not only have to do with the number of retail food outlets, but also the availability, quality, and marketing of healthy food within stores.
Figure 6, “Measured walkable access to healthy food, perceived quality, and perceived availability of fresh food within neighborhoods across obese individuals reporting cutting and not cutting meals. Walkable access to healthy food data were downloaded from opendataphilly.org (accessed 8/12/2016).”
Health Care Utilization
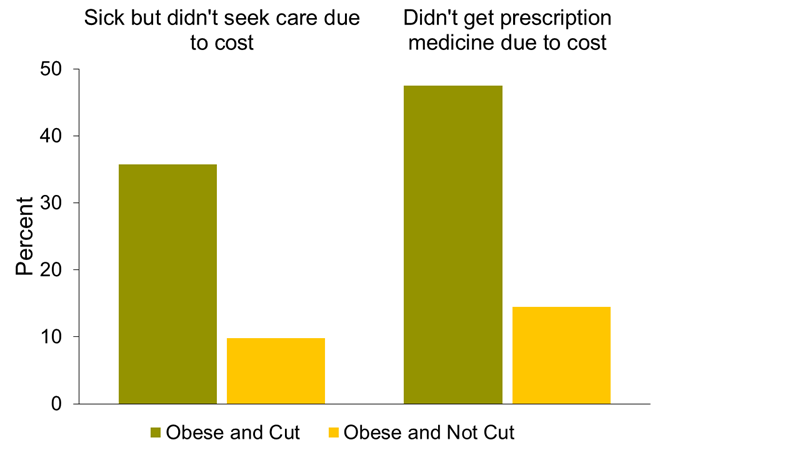
People who are obese and cut meals may not be utilizing needed health services. As seen in Figure 7, 36 percent of Philadelphians who cut meals were sick but did not seek care due to cost, compared to 10 percent of those who did not cut meals. In addition to foregoing medicare care, 48 percent of Philadelphians with obesity who report cutting meals also reported not purchasing a prescription due to cost -- compared to 14 percent of those who did not report cutting meals.
Figure 7, “Percent of obese respondents who report not utilizing services due to cost according to whether they cut meals or not”
Opportunities for Intervention
Local, state and federal policies have the power to promote environments that influence health behaviors and food access. The following policies, programs and initiatives are just a few examples of efforts taken to address both food insecurity and obesity.
- WIC - In 2009, the WIC food package included whole grains, fruits and vegetables, and reduced fat milk for the first time.
- SNAP - The SNAP program improves food security for low-income households and encourages healthy choices through marketing and education. In 2010, the Congress redirected SNAP nutrition education efforts to include a specific focus on obesity prevention.
- Healthy Corner Store Initiative - The Healthy Corner Store Initiative, implemented by the Food Trust and the Philadelphia Department of Public Health, aims to increase availability and awareness of healthy foods in corner stores in Philadelphia.
- Philly Food Bucks - Philly Food Bucks, also implemented by the Food Trust and the Philadelphia Department of Health, is a bonus incentive program offered to SNAP recipients at farmers markets. The participants receive a $2 coupon that can be spent on fruits and vegetables for every $5 spent at the farmers market.
CITATION
Hirsch A, Adams, M, Lucente A, Zhao Y, Moore K, Livengood K, Auchincloss A. Patterns of Obesity and Cutting Meals in Philadelphia. Philadelphia, PA: Drexel University Urban Health Collaborative; May 2018