A Measure of Gentrification for Use in Longitudinal Public Health Studies in the US

Methods Brief
August 2019
What is Gentrification?
Gentrification is a commonly discussed and often politically charged topic--in the media and among residents. But what does gentrification mean and how do we measure it? At its core, gentrification is one type of neighborhood change process. Table 1 shows several definitions that have been used in scholarly literature. While there is no universally accepted definition, common themes include reinvestment in a neighborhood after a period of decline and population compositional changes.
The UHC gentrification working group conceptualizes gentrification as a neighborhood change process that occurs over a period of time, measurable in three predominant ways:
- Compositional demographic shifts in a neighborhood
- Increased property values
- Physical signs of reinvestment, including improved streetscape appearance, beautification, access to healthy food and physical activity resources, and/ or signs of housing investment
The gentrification process occurs in previously low-income areas of a city, which had inadequate access to health-promoting resources and poor housing infrastructure. Displacement is a potential, but not inevitable, outcome of gentrification.
Table 1: definitions of gentrification used in key scholarly work pellentesque
| Author |
Definition |
| Hamell and Wyly 1996 |
Replacement of low-income, inner-city working class residents by middle- or upper-class households, either through market for existing housing or demolition to make way for new upscale housing construction.
|
| Bostic and Martin 2003 |
Neighborhood evolutionary process in which affluent, usually young households move into and upgrade distressed neighborhoods, with many of the neighborhood’s original residents being displaced. |
| Freeman, Lance 2005 |
The process by which declines or disinvestment in inner-city neighborhoods is reversed. |
| Ding, Hwang, Divringi 2015 |
The socioeconomic and physical upgrading of a previously low-income neighborhood, characterized by the influx of higher socioeconomic status residents and an increase in housing prices. |
History of the Term "Gentrification"
Did you know that the term gentrification was first introduced in 1964, by the sociologist Ruth Glass? In observing the changes that were occurring in inner London, Glass said, "One by one, many of the working class quarters have been invaded by the middle class-upper and lower. Shabby, modest mews and cottages - two rooms up and two down - have been taken over, when their leases have expired, and have become elegant, expensive residences...Once this process of 'gentrification' starts in a district it goes on rapidly until all or most of the working class occupiers are displaced and the whole social character of the district is changed."
What Measures of Gentrification Have Been Used Previously?
Guided by the varied definitions and the data most readily available, researchers have quantified gentrification in different ways. For example, displacement caused by gentrification may be a source of psychosocial stress or disrupt social connections within a community. Most measures that use census data use a two-pronged approach with respect to a pre-specified time period. First, they establish a threshold that determines whether a neighborhood qualifies as having been “gentrifiable” at the beginning of the period. Often, this threshold is based on the neighborhood’s household income level. Second, they classify the “gentrifiable” neighborhoods as having gentrified based on neighborhood compositional change, such as education level or housing/rental, over the time period. Researchers have used varied types of alternative data. Some have reviewed city planning documents or local media publications to develop a list of gentrified neighborhoods. Others have conducted either physical or virtual audits for evidence of reinvestment, beautification, or the lack of disorder. Still others have used data to quantify changes in amenities—including counting new coffee shops!
Why Did UHC Decide to Make Our Own Measure and What Does it Offer?
Change within city neighborhoods, including gentrification, may be an important predictor of wellbeing. For example, gentrification may be a source of psychosocial stress or disrupt social connections within a community. On the other hand, changes to health-promoting assets may accompany gentrification. This could be improved built environment resources (e.g. green space, active transport, public transportation), higher quality public education, better health care, or healthier food access. To investigate this process, which has clear relevance to urban health and health equity, requires that we define and operationalize gentrification. Our measure was designed after considering measures from sociology, geography, and urban studies. It offers public health a means of conceptualizing and measuring gentrification nationally and longitudinally. It builds on previous measures by combining strengths from a number of different common measures. Specifically, similar to other work (Ding, Hwang, Divringi 2016 & Freeman 2005), our measure:
- Uses only nationally available data, specifically population census data, to allow for examination over time across a broad range of geographic areas. This also facilitates connection to large, population-based cohort studies in public health. However, it means we cannot capture physical signs of reinvestment (part of our definition) so we continue to work on audit and survey tools to identify this aspect of gentrification.
- Uses a two-stage process to identify and remove tracts that are ineligible to gentrify, defined by those that either 1) are wealthy or 2) have very few residents (<50) and are probably industrial areas.
- Focuses specifically on shifting affordability and economics to allow future analyses to examine whether the impacts of gentrification vary across different socio-demographic groups (e.g. across categories of race, age, or occupation).
- Allows for stages of gentrification (rather than being a binary measure--gentrified/not) to (1) recognize gentrification as a process and (2) acknowledge differences in the rate of gentrification.
Details on the UHC Gentrification Measure
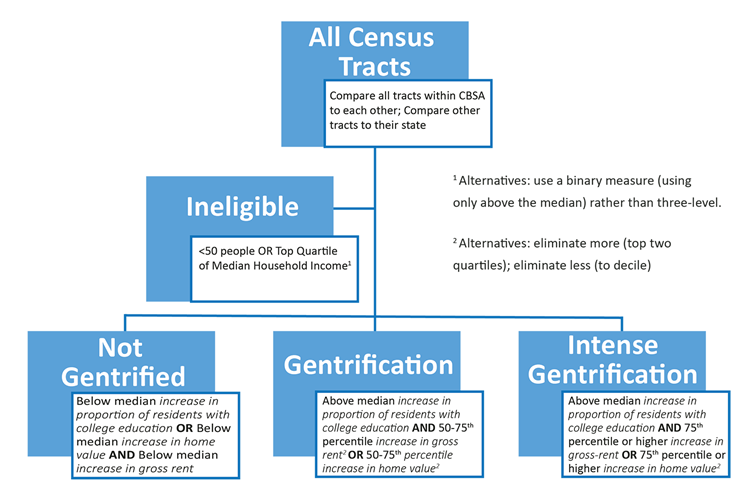
The UHC’s measure identifies census tracts that have gentrified using a two-step process:
- Identify census tracts that are eligible to gentrify at a specified baseline
- Of those that were eligible, identify the tracts that show evidence of moderate or intense gentrification between the baseline and a follow-up year.
This results in four categories of gentrification: (see Figure 1)
- Ineligible to gentrify
- Eligible to gentrify but did not gentrify
- Evidence of gentrification
- Evidence of intense gentrification
To calculate the measure we use four variables:
- Median household income
- Percent of residents with a college degree or higher
- Gross rent
- Home value
While the measure can be calculated for any small geography within a city, and for any baseline year or length of follow-up, we used 2010 census tract geographies and calculated a measure for 1990-2000 and 2000-2010.

First, we remove any neighborhoods (defined by census tract) that are sparsely populated (<50 people) or were already wealthy (in the top quartile for median household income for their residential area). This is to remove non-residential areas or areas that never had a period of disinvestment. Next, we identify which of the remaining eligible tracts have experienced substantial increases in college educated residents and housing cost. To gentrify, tracts must have experienced two things: increases in proportions of residents with a college education and increases in either rent or home value. Specifically, to qualify as gentrified, tracts must have experienced an increase in the proportion of residents with a college education that was above the median change in their area (city for urban tracts; state for rural tracts). We chose education level, rather than other sociodemographic indicators, because it represents high earning potential, even if residents do not yet have high incomes. Second, tracts must have experienced increases in gross rent or median home value that was above the median change for their area. We created categories for moderate and intense gentrification based on the extent to which education and rent/housing price changed. Specifically, tracts that experienced an increase that was between 50-75th percentile of the distribution of change in these variables for their area, were classified as having “gentrified.” If they were in the top quartile of change then they were classified as having experienced “intense gentrification.”
What About Race?
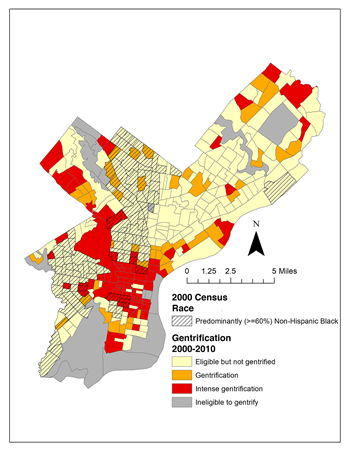
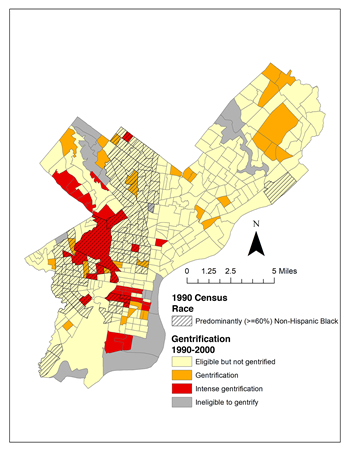
Given historic and current patterns of disinvestment, structural racism, and red lining, gentrification often plays out along racial lines. Several scholars indicate that, within the U.S., race is an integral part of defining gentrification (Goetz, 2011), while others posit it is independent from gentrification (Bostic & Martin, 2003). Our definition and operationalization do not include racial change. However, the way gentrification impacts residents and their health will likely vary for neighborhoods with different racial or ethnic makeups or for residents of different races living within the same neighborhood. Moreover, changes in racial composition may have important effects on how neighborhood change is perceived and understood by residents. On our maps we show predominantly black areas to contextualize our gentrification measure.
Using a Relative Measure Versus an Absolute Measure?
The UHC measure, like others in the literature, uses a relative rather than an absolute measure of gentrification. By this, we mean that it compares neighborhoods to other neighborhoods in their own city (for urban places) or to similar rural neighborhoods within their state. This means that a neighborhood may still have a huge absolute increase in college-educated individuals, but it would not be considered gentrifying if the rest of the city experienced the same or higher levels of increase. This was done so that the measures pick up neighborhoodlevel changes, instead of broad changes for a whole region or city.
Variants on the Measure
We also created five variants on our measure. These allow flexibility in the definition or allow a researcher to test different measures to see if results are similar. First, we have two alternate cut-points for determining eligibility of gentrifiable tracts (above the median or top decile rather than top quartile). Second, we have also proposed a binary measure of gentrification rather than the three-level/intensity of gentrification.
What Does UHC's Measure Look Like Here in Philadelphia?
This map shows what the gentrification measure we created looks like in Philadelphia between 1990-2000 and 2000- 2010. You can see large areas gentrifying in Center City and University City. Notice that many of the suburban and industrial areas were ineligible to gentrify because they had too few people or were too wealthy.


This Measure is Not...
- …a gold standard. While we drew on previous literature, this measure is by no means a gold standard for measuring gentrification. You may live in one of the neighborhoods identified as “not gentrified” and feel intense change or displacement pressure.
- …a perfect local measure. In order to make a measure that works for the entire U.S., we did not draw from local knowledge or experience, nor did we review media reports or city documents. A more locally tailored measure may be preferred when comparison to a broad set of places across the U.S. is not of interest.
- …a measure of all aspects of the gentrification process. This measure does not capture built environment or social and cultural changes, which may be important pieces of the gentrification process. We are currently exploring ways by which additional local and national datasets might be related to this measure of population and economic change.
- …your perception of gentrification. You may perceive that a place is changing long before the variables within the national data that we selected capture these changes. Or you may be picking up on aspects not included in this measure (like new stores). We are working to develop a survey of perceived neighborhood change, which will better gauge the experience of being a resident in a shifting neighborhood.
- …a full picture of neighborhood change. A neighborhood may gentrify in none, one, or multiple time periods in a row. You may want to think about and distinguish between places that experience “continued gentrification” (multiple time periods in a row), “stalled gentrification” (gentrification in an earlier time period but not a subsequent time period despite being eligible), or “completed gentrification” (gentrification in an earlier time period such that they are ineligible to gentrify in a subsequent time period).
CITATION
Hirsch J A, Schinasi L H. A measure of gentrification for use in longitudinal public health studies based in the United States. Philadelphia, PA: Drexel University Urban Health Collaborative; August 2019
References
- Bostic, Raphael W., and Richard W. Martin. "Black home-owners as a gentrifying force? Neighbourhood dynamics in the context of minority home-ownership." Urban Studies 40.12 (2003): 2427-2449.
- Ding, Lei, Jackelyn Hwang, and Eileen Divringi. "Gentrification and residential mobility in Philadelphia." Regional science and urban economics 61 (2016): 38-51.
- Freeman, Lance. "Displacement or succession? Residential mobility in gentrifying neighborhoods." Urban Affairs Review 40.4 (2005): 463-491.
- Glass, Ruth. "Aspects of change." The gentrification debates: A reader (1964): 19-30.
- Hammel, Daniel J., and Elvin K. Wyly. "A model for identifying gentrified areas with census data." Urban Geography 17.3 (1996): 248-268.