Creating the Investment Prospectus for Your City
Section 4: Your City by the Numbers
This section of the Prospectus is intended to provide the quantitative information necessary to illustrate the strengths of the city and/or the MSA. Generally, this information is comprised of publicly available socio-economic data from the United States Census Bureau, but may be augmented by proprietary data sets or statistics generated from more bespoke reports focusing on a particular aspect or feature of a city’s economy. The major elements of this section include highlights of the city/MSA’s economic indicators; employment industry profiles; major employer statistics; and accolades, awards, and rankings.
Louisville Metro Economy
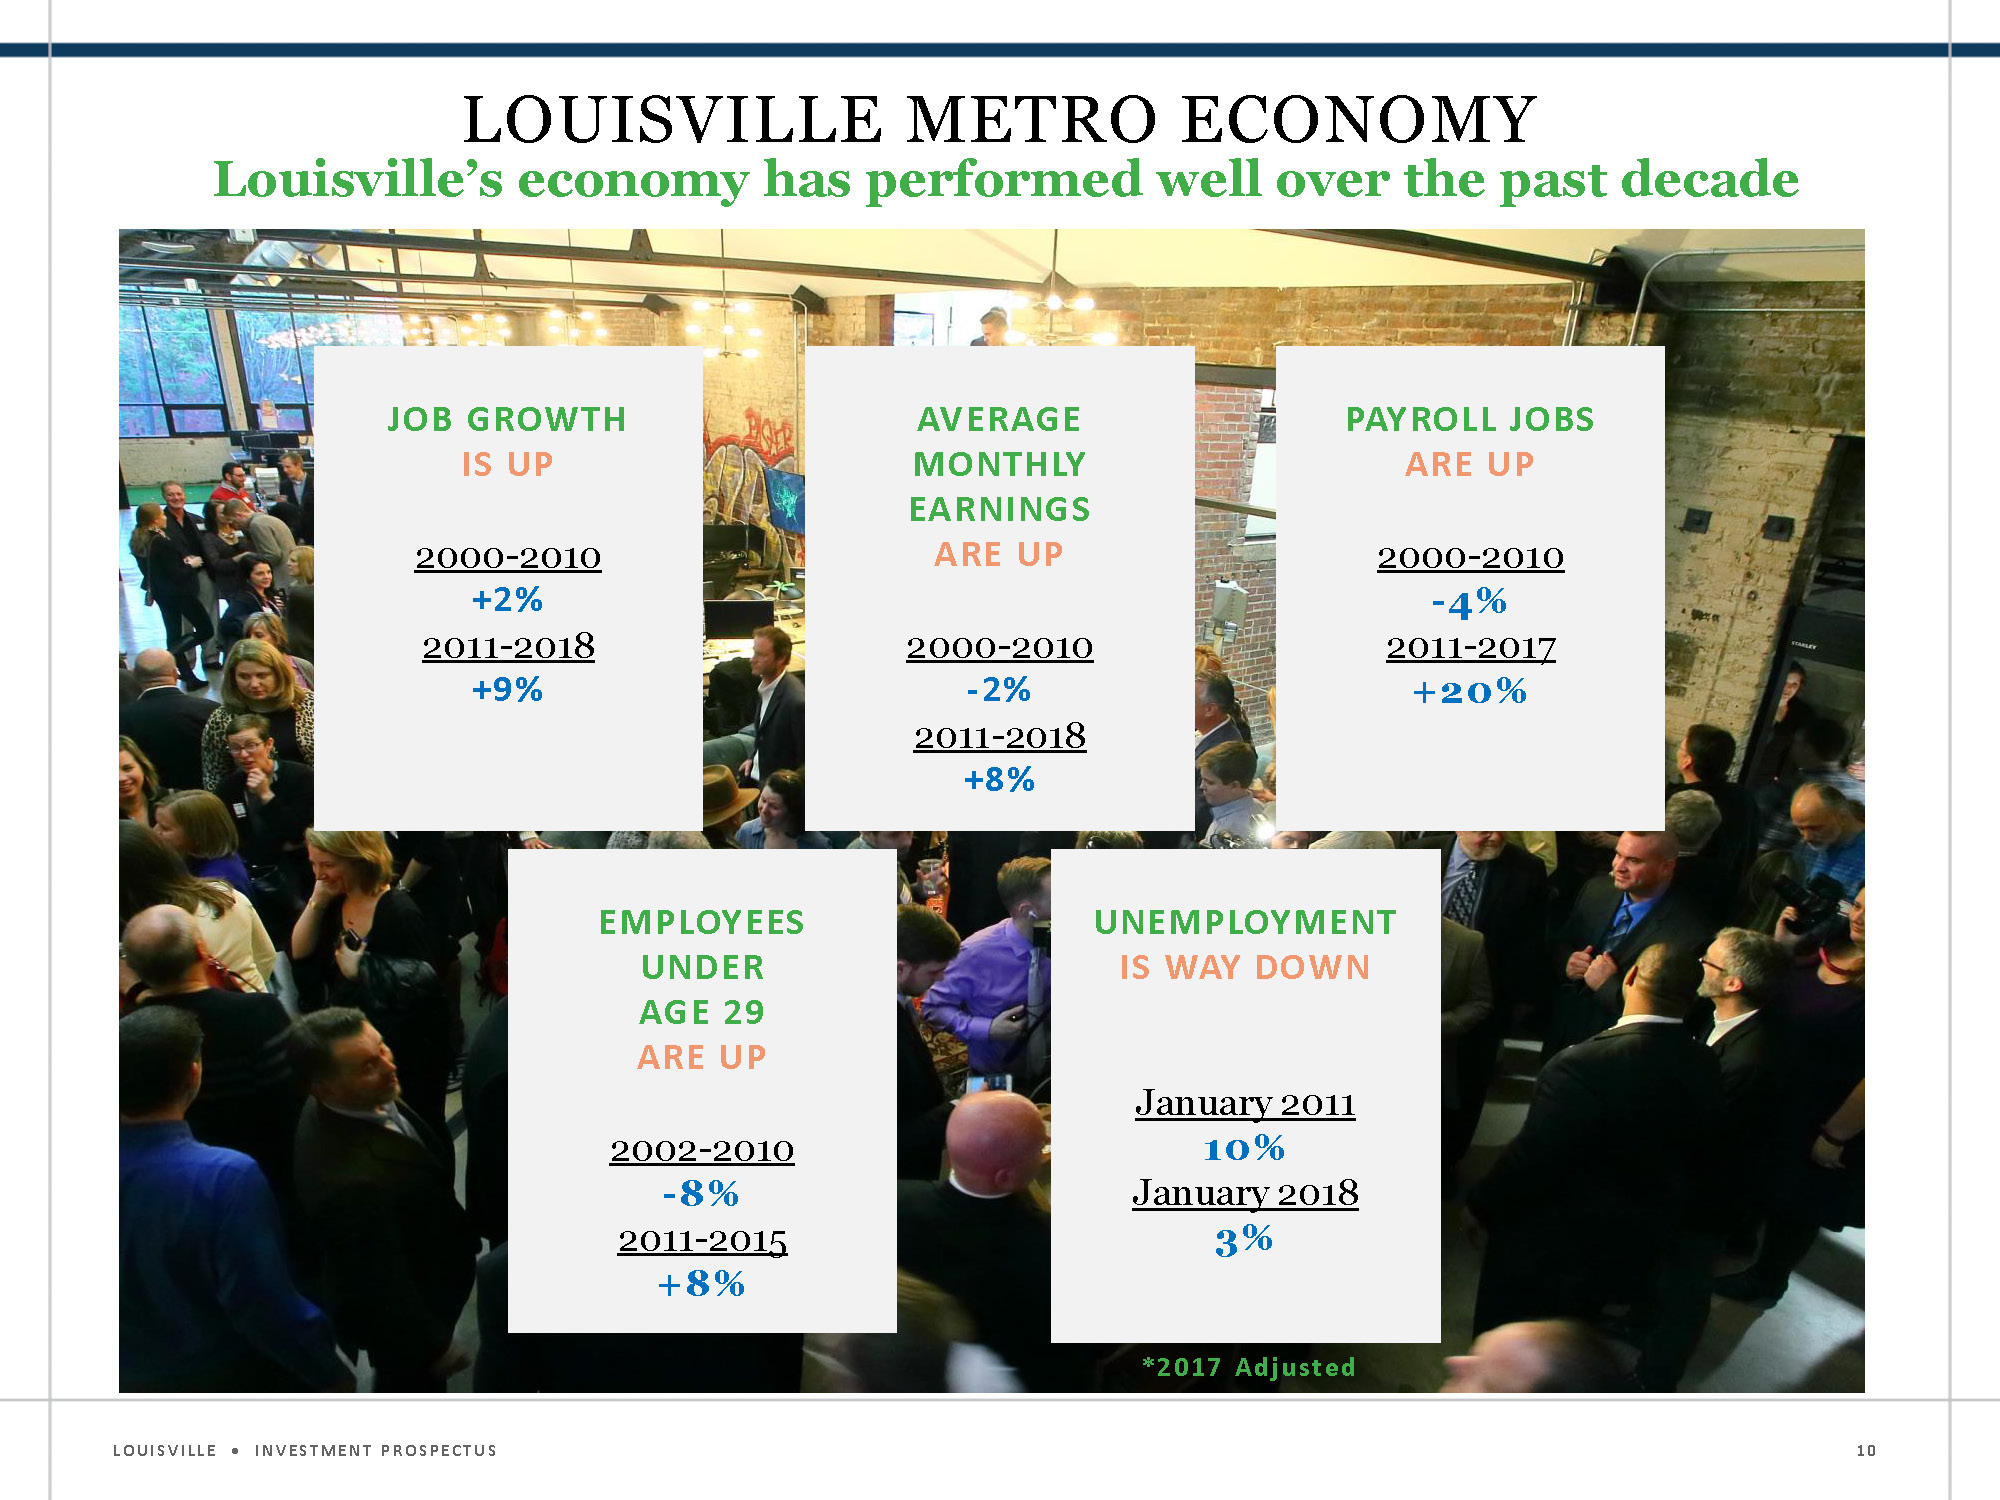
Louisville's economy has performed well over the past decade
Job growth is up
2000 - 2010 +2%
2011 - 2018 +9%
Average monthly earnings are up
2000 - 2010 -2%
2011 - 2018 +8%
Payroll jobs are up
2000 - 2010 -4%
2011 - 2017 +20%
Employees under age 29 are up
2002 - 2010 -8%
2011 - 2015 +8%
Unemployment is way down
January 2011 10%
January 2018 3%
Economic Indicators
In the slide from the Louisville Prospectus to the right, key economic growth indicators are summarized by comparing two time periods for each indicator: the first, from 2000 to 2010, and the second, from 2011 to the present. Calculating the percent changes for both of these sections and comparing the two can illuminate positive trends occurring in your respective city (and, at a more micro level, your city’s opportunity zones).
While Louisville identifies its performance by job growth, increases in monthly earnings, payroll jobs, and younger employees, and decreases in overall employment, other economic indicators could be included and may be more appropriate for conveying the economic strengths or opportunities available in your municipality.
The following data sources and tools may prove useful for highlighting and discerning these statistical trends about your city:
It should be noted that these sources provide data at the Metropolitan Statistical Area and county levels, which may span multiple municipalities, although you may wish to include a similar slide that looks at your core city or outlying municipalities specifically. For evaluating economic indicators at an individual city or tract level, you may need to access data from the US Census, the Bureau of Labor Statistics, or your local county or municipal economic development agency. For more data sources and tools relevant to constructing the Investment Prospectus, see the Resources for Creating the Investment Prospectus section.
Louisville Employment Profile
Impressive growth in professional and business servicess as a share of the economy
|
2002 Count |
2015 Count |
2002 - 2015 Growth |
2002 - 2015 % Growth |
| Trade, Transportation and Warehousing |
100,157 |
104,067 |
3,910 |
3.9% |
| Health Care, Social Assistance & Educational Services |
74,942 |
89,396 |
14,454 |
19.3% |
| Professional & Business Services |
50,929 |
66,910 |
15,981 |
31.4% |
| Manufacturing |
44,251 |
47,145 |
2,894 |
6.5% |
| Accomodations and Food Services |
29,352 |
37,037 |
7,685 |
26.2% |
| Finance and Insurance |
26,810 |
32,829 |
6,019 |
22.5% |
| Construction, Mining & Utilities |
21,931 |
21,639 |
-292 |
-1.3% |
| Public Administration |
11,562 |
10,884 |
-678 |
-5.9% |
| Information |
10,763 |
8,572 |
-2,191 |
-20.4% |
Employment Profiles
Building off of the economic indicators, cities should drill-down and show job growth within leading economic sectors. In the Louisville example, data from the US Census Bureau and the Bureau of Labor Statistics is organized according to industry sector. Counts of total numbers of jobs in each sector is listed for a reference year (2002 in this case) and the most currently available data (2015 here), with the total increase in numbers of jobs and a percent change associated with each industry sector.
Data Sources:
US Census Bureau On The Map App
Bureau of Labor Statistics
Louisville's Largest Non-Government Employers
National leader in lifelong wellness and aging care, advanced manufacturing and logistics
| Employer |
Type of Business |
Approximate Number of Employees |
| United Parcel Services Inc. |
Global commerce services |
22,354 |
| Food Motor Co. |
Automotive Manufacturer |
12,600 |
| Humana Inc. |
Health Insurance |
12,500 |
| Norton Healthcare Inc. |
Health Care |
11,944 |
| University of Louisville |
Higher Education |
6,901 |
| Baptist Healthcare Systems Inc. |
Health Care |
6,786 |
| Amazon.com |
Logistics and customer service |
6,500 |
| GE Appliances, a Haier company |
Appliance manufacturer |
6,000 |
| KentuckyOne Health |
Health Care |
6,000 |
| The Kroger Co. |
Grocery retailer |
3,070 |
Largest Employers
In addition to illustrating the various growing industry sectors in a given city, prospectuses should also articulate their top non-government employers and the number of people they employ. This information can help investors understand competitive strengths and agglomeration economies present in a municipality. Additionally, these anchor institutions may play multiple roles around Zones, depending on their location and sector. Here, Louisville lists its top 10 largest employers and the types of businesses they represent.
Although this data is not universally available from any official source, your state or local chamber of commerce or economic development agency may already have these lists compiled, or at the very least prove useful in deriving this information from other sources. For more information about engaging anchor institutions in opportunity zone strategies, see the Nowak Metro Finance Lab's report From Transactions to Transformation.
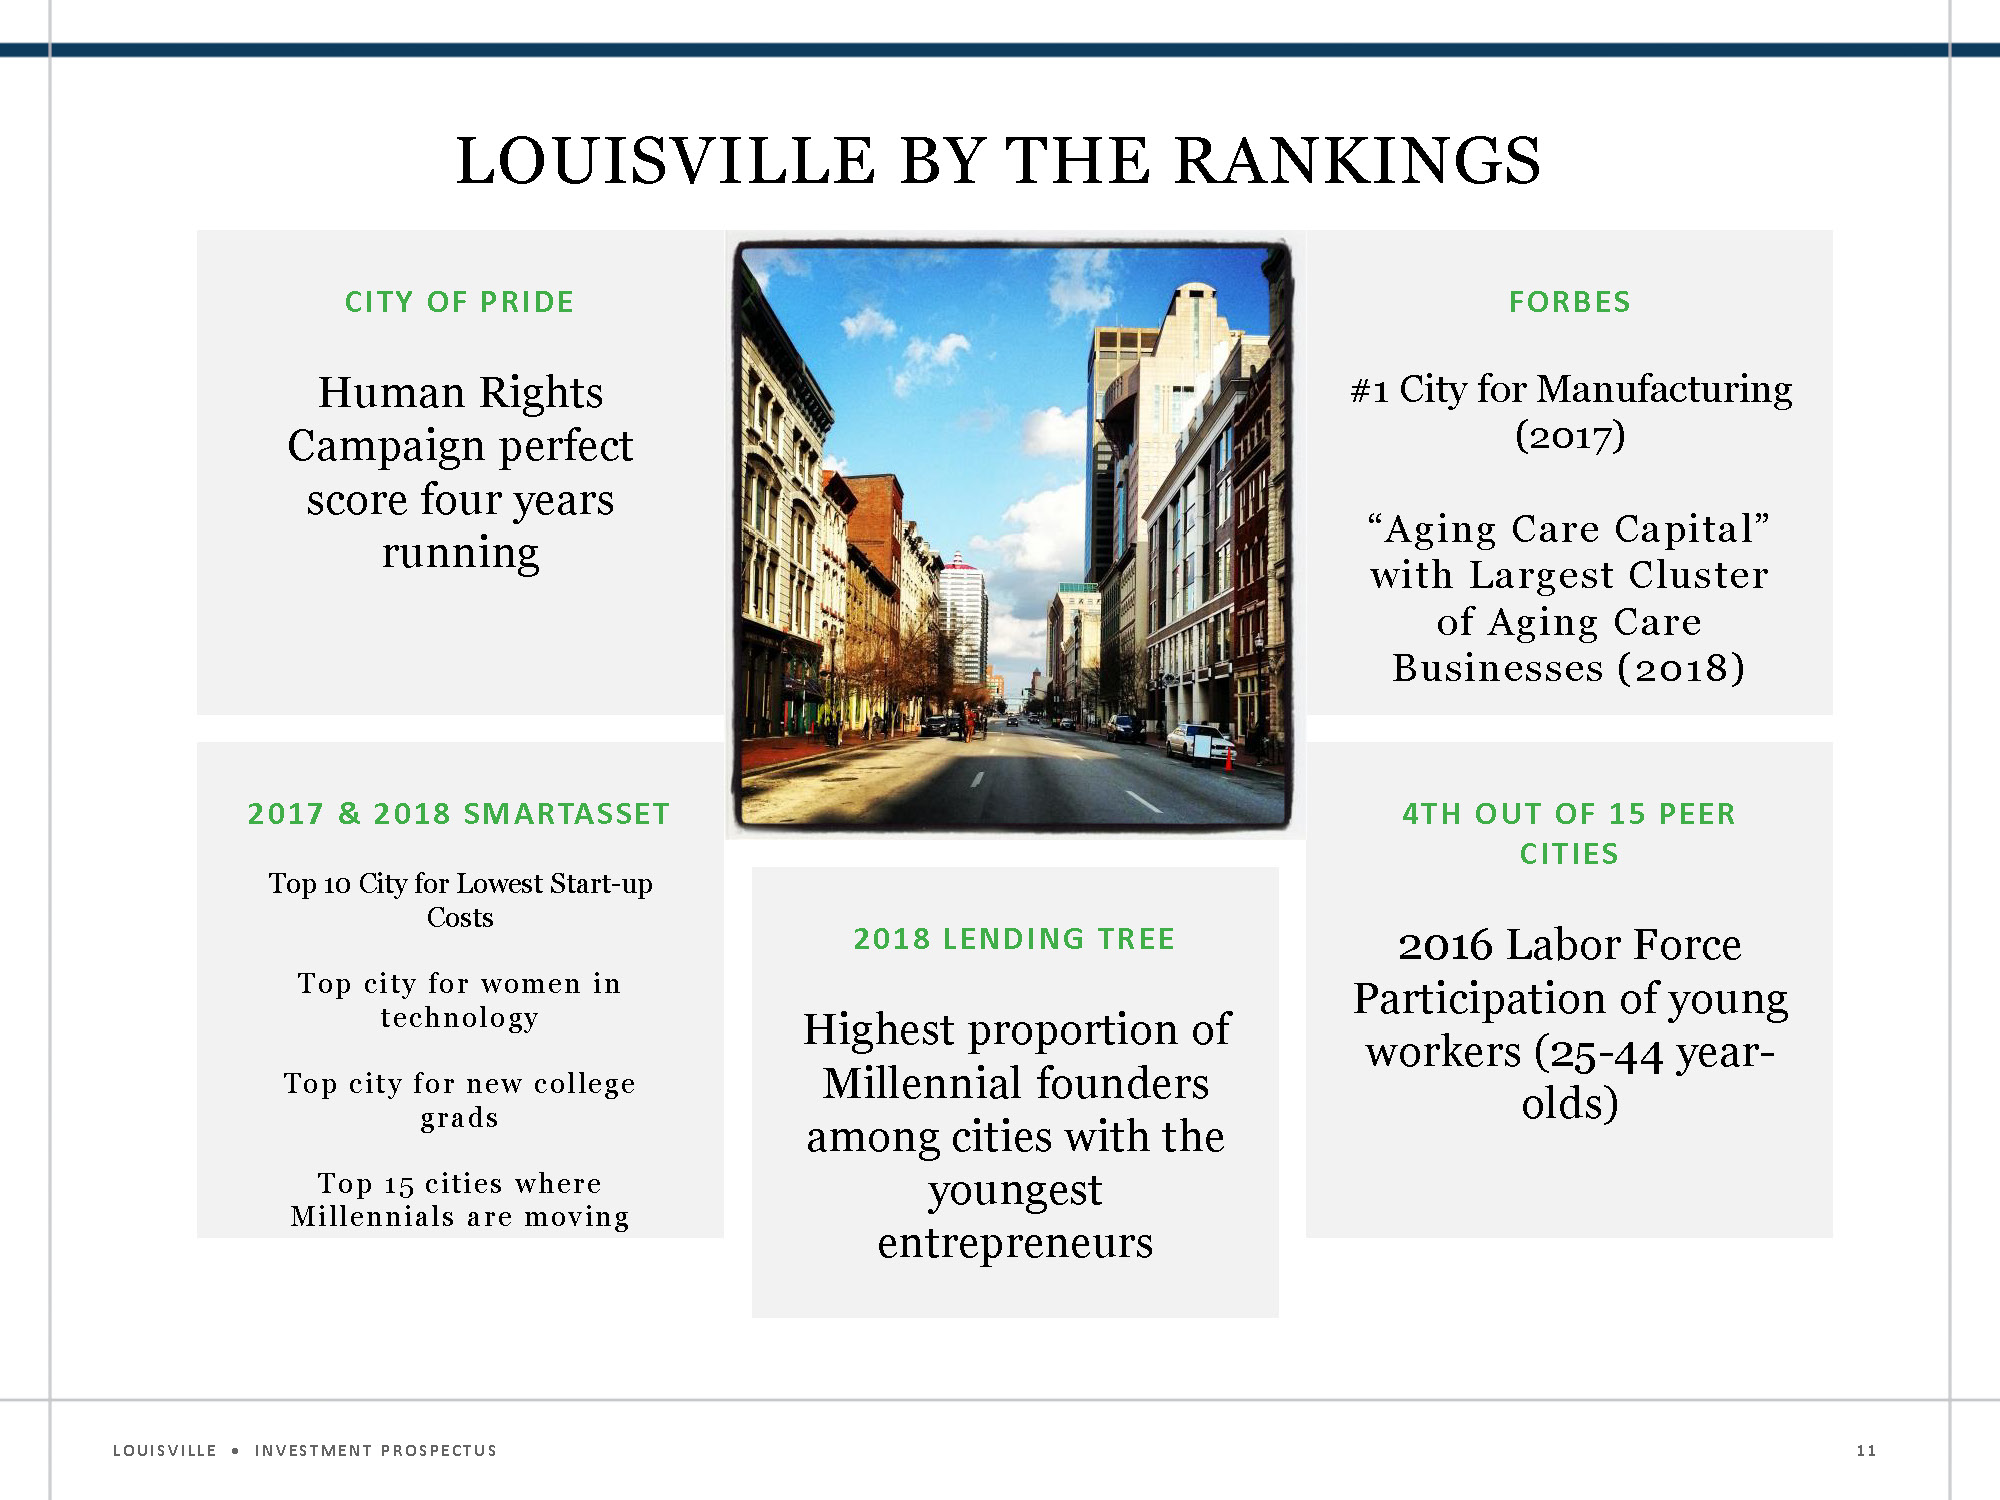
Louisville by the rankings
City of Pride
Human Rights Campaign perfect score four years running
Forbes
- #1 City for Manufacturing (2017)
- "Aging Care Capital" with Largest Cluster of Aging Care Businesses (2018)
2017 & 2018 Smartasset
- Top 10 city for lowest start-up costs
- Top city for women in technology
- Top city for new college grads
- Top 15 cities where Millenials are moving
2018 Lending Tree
Highest proportion of Millenial founders among cities with the youngest entrepeneurs
4th out of 15 Peer Cities
2016 Labor Force Participation of young workers (25-44 yearolds)
City/Region Rankings and Accolades
Cities should be continually taking stock of how they are portrayed in the media, particularly those articles that demonstrate their competitive advantages. A city’s investment prospectus should highlight areas where the city has been positively recognized, including rankings or awards. Keeping a running list of these awards is a valuable low-hanging fruit for cities, as these analyses are frequently conducted by third-party organizations and cities merely need to reference those accolades in their prospectuses rather than produce these comparative studies themselves.
In the Louisville prospectus, they cite recent awards and rankings from organizations like the Human Rights Campaign, SmartAsset.com, Lending Tree, and Forbes, but your city may receive accolades from other media outlets.