Creating the Investment Prospectus for your City
Section 3: Introduction to Your City
These sections of the investment prospectus are intended to orient investors to your city’s contextual features, including socio-economic data points and trends occurring in your city, economic development incentives or tools that may also be available to potential projects in Opportunity Zones, and key contacts at city or NGO agencies involved with the municipality’s economic development activities.

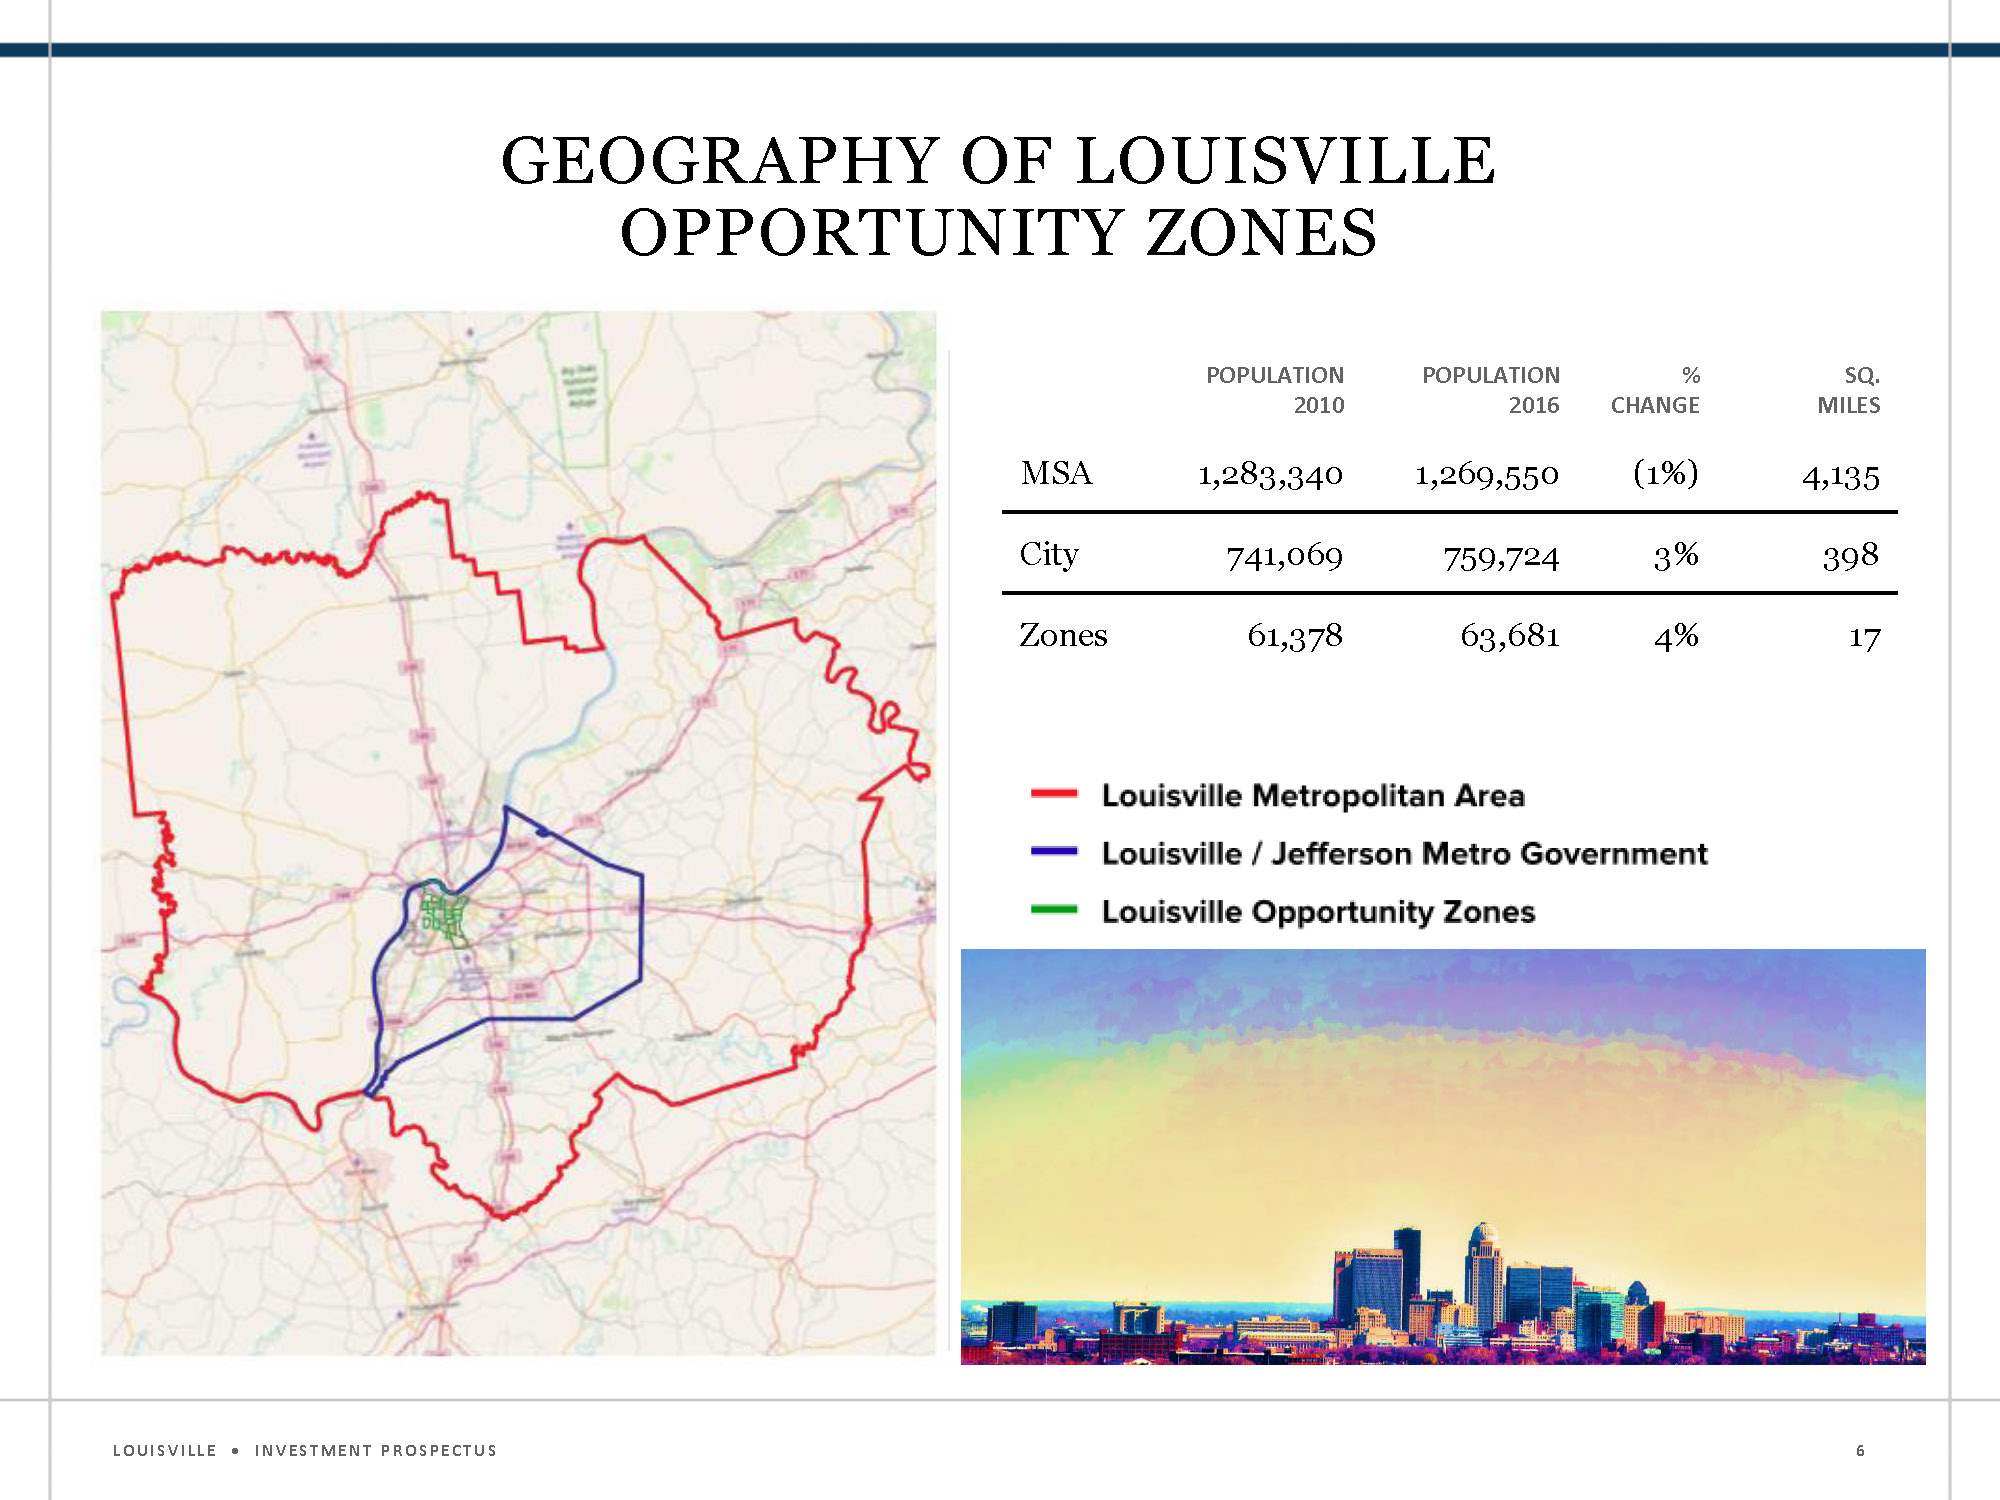
Geography of Louisville opportunity zones
|
Population 2010 |
Population 2016 |
% Change |
Sq. Miles |
| MSA |
1,283,340 |
1,269,550 |
(1%) |
4,135 |
| City |
741,069 |
759,724 |
(3%) |
398 |
| Zones |
61,378 |
63,681 |
(4%) |
17 |
Overview of the MSA, City, and OZs in Your City
This section provides a population and spatial overview of the Metropolitan Statistical Area (MSA), the City itself, and the Opportunity Zones within it.
The Louisville Prospectus includes population figures for its MSA, City, and Opportunity Zones in a reference year (2010) and the most recent available estimates (2016, in this case). A percentage change was then calculated between the two years.
Much of this data is publicly available from the United States Census Bureau’s American FactFinder app, in addition to tools like PolicyMap or ESRI’s Business Analyst. Area statistics are often included as part of the US Census’ TIGER/Line files for specific geographies (Cities, Counties, and Census Tracts), but can also be calculated with a geospatial application such as the subscription-based ArcMap from ESRI or the open-source Quantum GIS.

Louisville Momentum
By The Numbers
- Merged City/County with population over 770,000
- Thriving downtown with billions of dollars in capital construction since 2014
- From 2010 - 2013 to 2014 - 2017 a 66% increase in venture capital deals
By The Assets
- Diverse set of large employers (shipping, healthcare, manufacturing, education)
- City commitment to education, workforce development, equity and inclusion
- Fortune 500 HQs (Humana & YUM! Brands)
By The Opportunity Zones
- Zones were selected reinforcing multiple growth hubs
- Zones include planned and underway catalytic projects
Summary of a City’s Momentum
This slide is comprised of highlights from the three sections of the prospectus that follow:
This section highlights specific socio-economic statistics and accolades for an MSA or City as a whole. In the Louisville Prospectus, its merged city/county population growth, capital investment, and venture capital activity are highlighted as strengths that may be of interest to investors.
This section identifies activities, initiatives, or other information related to potential Opportunity Zone projects. In the case of Louisville, this includes its diversified employment sectors, ongoing commitment to equity and inclusion regarding education and workforce development, and the presence of Fortune 500 headquarters in the city.
This section explores each Opportunity Zone more deeply, grouping them by similar geographies, highlighting socio-economic data points, and illustrating planned or ongoing projects. Highlights for Louisville include the presence of industry growth hubs, in addition to numerous planned and underway projects, within the city’s Opportunity Zones that could synergize with future investment in those areas.
When building this piece of the prospectus, it is best to complete the content for each of the above sections first, and then pull “headlines” from the content for use in this slide.

Louisville Opportunity Zone Lead
- Louisville Metro Government is one of the most successful examples of city/county consolidation in the country
- Lead agency: Louisville Forward is the city's one-stop agency for economic development, talent and workforce attraction, and land use and planning design. Louisville Forward provides a unified solution for job growth and quality of place, making it easier to go from start to finish on projects large and small
- The city has a strong fiscal base, with solid bond ratings
- Louisville Opportunity Zones were smartly selected
- Louisville Opporunity Zone points of contact:
- Mary Ellen Wiederwohl
Chief of Louisville Forward
maryellen.wiederwohl@louisvilleky.gov
- Eric Burnette
Senior Policy Advisor for Louisville Forward
eric.burnette@lousivilleky.gov
Summary of a City’s OZ Incentives, Contacts, and Websites
This section is intended to introduce what the city is doing to help promote and/or guide Opportunity Zone investments. This includes additional incentives (if any) and points of contact at the city or other related entities involved in facilitating development in their respective municipality.