Borrowing Information from Neighbors: Estimating Health in Small Areas

Methods Brief
December 2019
Why do "small areas" matter?
Within a city there can be lot of differences in health across neighborhoods. Having estimates from surveys of residents for smaller areas within a city allow researchers, city officials, and public health practitioners to identify areas of high need and allocate resources.
Typically, “small areas” refers to geographically small regions – e.g., a block, census tract, or neighborhood. However, many of the challenges we face in describing health in small geographic areas are also present for larger geographic areas when the number of health events or survey responses in the area is low.
What challenges do "small areas" present for health descriptions?
Health data available for small areas is often limited because few events occur (e.g. few deaths) or because the number of respondents to a health survey living in the area can be small. For example, figure 1 shows five neighborhoods. We want to estimate the proportion of persons with diabetes in each neighborhood. We conduct a survey but some of the neighborhoods do not have enough participants in our survey to give us values that we trust. For example, one neighborhood ended up having only one person who responded to the survey —if that person has diabetes should we assume 100% of people in that neighborhood have diabetes? Similarly, some neighborhoods have no participants, leaving us in the dark as to what might be happening there. Similar challenges occur when estimates of mortality rates are based on small number of deaths because the population living in the area is small.

What is "small area estimation"?
Small area estimation techniques are a way to overcome the problems described above to provide more reliable estimates when sample sizes for certain areas are small.
Spatial Smoothing
One technique uses information from one neighborhood to understand another (this is called “spatial smoothing”) (figure 2). It is based on the idea that areas near each other are often more similar than areas which are farther away from each other.

Temporal Smoothing
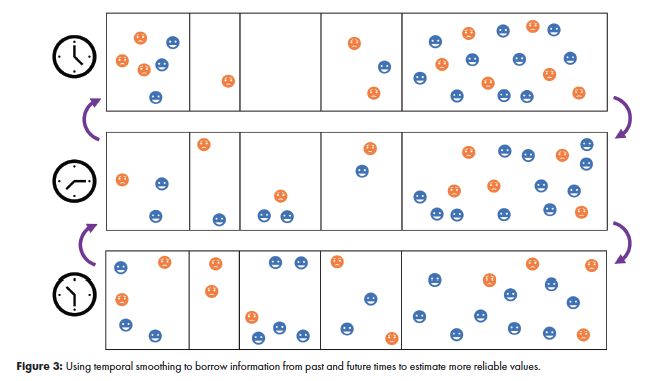
Another technique uses information from the same neighborhood at a different point in time (this is called “temporal smoothing”) (figure 3). It is based on the idea that a given place is often similar over time. Time points near each other will be more similar than time points farther apart.

UHC small area estimation
Our method uses both spatial and temporal smoothing (figure 4). In this way we are able to borrow strength from nearby neighborhoods and also from the same neighborhood across time. To do this, we use Bayesian hierarchical models* that account for space and time. Other characteristics of neighborhood residents (like age distribution or poverty level as well as other characteristics that would ordinarily be captured in survey weights) can also be included when they are known predictors of the health outcome and can therefore be used to further improve estimates.

Data source for UHC small area estimates
UHC small area estimates use PHMC SEPHHS data from 2000-2015. The Public Health Management Corporation's (PHMC) Community Health Data Base’s Southeastern Pennsylvania Household Health Survey (SEPHHS) is a series of surveys that collect data on health and social well-being1. Over the past 15 years, the SEPHHS has gathered information on more than 10,000 households in Bucks, Chester, Delaware, Montgomery, and Philadelphia Counties.
*Our Models
If you are interested in learning more about our small area estimation methods please refer to our paper: Quick H, Terloyeva D, Wu Y, Moore K, Diez Roux AV. Trends in Tract-Level Prevalence of Obesity in Philadelphia by Race-Ethnicity, Space, and Time. Epidemiology. 2020 Jan;31(1):15-21.2
Example: small area estimation of obesity prevalence for Philadelphia
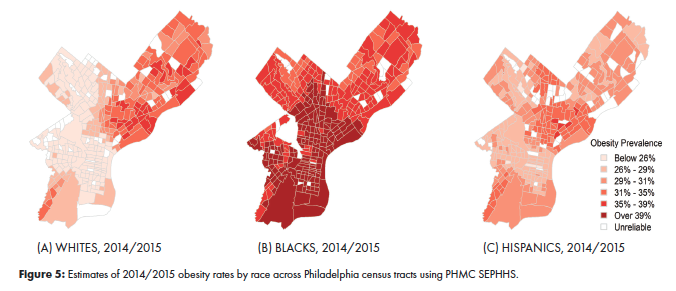
To illustrate our approach we use the example of obesity prevalence in Philadelphia census tracts. Our method yields estimates of obesity prevalence (figure 5) and disparities in obesity prevalence (figure 6) for each census tract at all time-points by age, race, sex, and poverty status. These estimates can then be appropriately combined to generate overall estimates for each tract (for example stratified by race but reflecting the poverty and sex distribution in each tract, as shown in figure 5).


How UHC small area estimation can be used
Small area estimates for neighborhoods within cities can help us describe and understand the drivers of health and health inequities, can motivate interventions and policies, and can be used to track the impact of interventions and policies. Specifically, small area estimates can be used to:
- Describe and understand
- Compare rates of health behaviors and disease across neighborhoods (see figure 5)
- Contrast levels of health inequities (by race for example) across neighborhoods (see figure 6)
- Examine trends over time for neighborhoods within a city
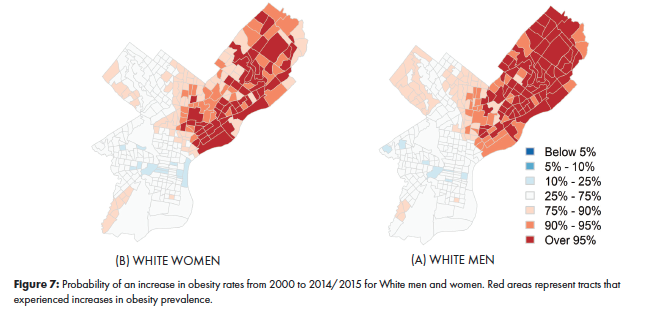
- Determine which neighborhoods drive city-level trends (see figure 7)
- Empower residents with knowledge useful for advocacy and local action
- Generate research questions about the drivers of neighborhood differences
- Motivate interventions and policies
- Identify areas of higher need to allocate resources (see figure 5)
- Identify actions to reduce spatial inequities
- Track changes over time in response to policies or interventions
- Follow health behaviors after new smoking, nutrition, or physical activity policies
- Examine impacts of new development and investment
Example: determining which neighborhoods are driving city trends in obesity
After seeing that there is an increase in white male obesity rates at the city level, we can use the obesity small area estimates to highlight which neighborhoods may be driving that change (figure 7). In these maps the increase in obesity rates among white men seems to be driven by northeast Philadelphia.

UHC small area estimates
UHC has produced small area estimates for Philadelphia using PHMC SEPHHS data of:
- Health Outcomes
- Obesity; Hypertension; Diabetes; Self-rated health; Mental health (number of days of poor mental health) and Stress (10-point Likert scale; dichotomized as more than average stress (5-10) or extreme stress (8-10)); Activities of daily living limitations; Child and adult asthma
- Health Behaviors
- Current smoking status; Sugary beverage consumption; Cancer screening such as colonoscopy/sigmoidoscopy; Physical activity; Skipping meals due to cost
- Social Determinants and Neighborhood
- Daytime safety; Access to parks; Access to supermarkets; Social capital; Neighborhood improvement; Participation in neighborhood activities
Accounting for individual factors related to health
Small area estimation allows us to account for a range of individual factors related to health. In the examples shown in this brief we opted only to account for age, race, sex, and poverty status. But other characteristics can also be incorporated. The use of these individual-level characteristics in the small area estimation has two benefits: (1) it allows is to adjust for these characteristics when comparing neighborhoods (i.e. how would neighborhoods compare if the age distribution of all neighborhoods were the same). and (2) it allows us to generate estimates that represent the conditions in neighborhoods (i.e. estimates in figures 5-7 reflect the poverty levels present in each neighborhood).
How does the UHC method differ from other small area estimates
The UHC method directly analyzes tract-level data to produce both tract- and city-level estimates. This is in contrast to recent approaches such as the work of the 500 Cities Project3. In their work, data from the 500 largest cities in the US are analyzed simultaneously to produce overall estimates for specific subpopulations (e.g., the average prevalence of obesity for all white men ages 35-44 across the 500 cities). These subpopulation-specific estimates are then used in conjunction with tract-specific population weights (e.g., from the American Community Survey) to produce estimates for tracts in each of the 500 cities in the study. The benefit of this approach is that it produces estimates for all 500 of the cities at once. The drawback, however, is that it ignores both between- and within-city disparities that might exist for these sub-populations.
Acknowledgments: UHC would like to thank Steven Melly, Guangzi Song, Yaxin Wu, and Yuzhe Zhao for their hard work in preparing the small area estimates.
CITATION
Quick H, Hirsch J A, Moore K A, Terloyeva D, Diez Roux A V. Borrowing Information from Neighbors: Estimating Health in Small Areas: Drexel University Urban Health Collaborative; December 2019
References
- Public Health Management Corporation. Community Health Data Base: Southeastern Pennsylvania Household Survey 2000-2015. 2015 [cited 2015 2/25/2015]; Available from: http://www.chdbdata.org/.
- Quick, H., et al., Trends in Tract-Level Prevalence of Obesity in Philadelphia by Race-Ethnicity, Space, and Time. Epidemiology, 2019.
- Center for Disease Control. 500 Cities: Local Data for Better Health. 2016 [cited 2018 12/01/2018]; Available from: https://www.cdc.gov/500cities/index.htm.