COVID-19 Health Inequities in U.S. Cities
Visualizing COVID-19 Health Inequities in Cities that are Members of the Big Cities Health Coalition
Summary
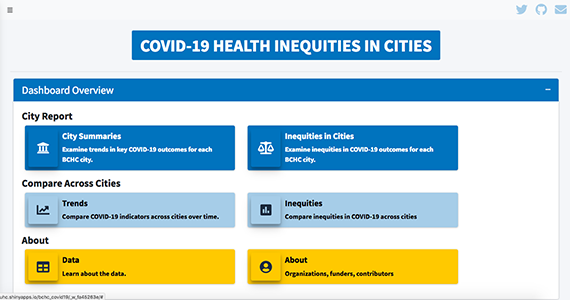
Drexel University’s Urban Health Collaborative has partnered with the Big Cities Health Coalition (BCHC) to release the “COVID-19 Health Inequities in Cities Dashboard”. This dashboard is a powerful data tool that enables visualizations of COVID-19 related outcomes and inequities over time and across BCHC cities. This project aims to inform decision-making by public health leaders in BCHC cities and will educate the public, policymakers, and public health officials about the ways in which race/ethnicity, neighborhood, and city characteristics influence COVID-19 outcomes.
Partners
Big Cities Health Coalition
Research Methods
Throughout the year 2021 the research team has regularly gathered, maintained, and updated COVID-19 outcomes and vaccination data. The team leveraged its the Urban Health Collaborative’s close partnership with the BCHC to define study objectives and audience. Additionally, the team developed an equity framework to guide indicator selection and conceptualize inequities in COVID-19 outcomes across individuals, neighborhoods, and cities. The research team worked with representatives from city and county health departments belonging to the BCHC to access and compile COVID-19 outcomes and vaccination data. Data was gathered from several publicly available repositories and local health departments. Currently, the dashboard has COVID-19 outcomes data for several large US cities including city level trend data for the 30 BCHC cities, neighborhood-level data for 16 cities and race/ethnicity data for 23 cities. In addition to data on COVID-19 outcomes, the dashboard also includes vaccination data including city-level data for 29 BCHC cities, neighborhood-level data for 16 cities, and race/ethnicity data for 13 cities. Aside from describing inequities across multiple levels, the dashboard allows users to visualize inequities in the spatial accessibility to COVID-19 testing by neighborhood characteristics across cities using testing site data from Castlight Inc. The team continues to update and maintain the interactive dashboard and web platform to allow interactive comparisons of COVID-19 health inequities across cities.
Acknowledgements
Research Team:
- Ana Diez Roux, MD, MPH, PhD, Co-Principal Investigator
- Jennifer Kolker, MPH, Co-Principal Investigator
- Usama Bilal, PhD, MPH, MD, Co-Principal Investigator
- Sharrelle Barber, ScD, MPH, Co-Investigator
- Pricila Mullachery, MPH, PhD, Postdoctoral Research Fellow
- Alina Schnake-Mahl, ScD, MPH, Postdoctoral Research Fellow
- Edwin McCulley, MS, Research Coordinator
- Ran Li, MS, Data Analyst
- Heather Rollins, MS, Data Analyst
- Vaishnavi Vaidya, MPH, Project Manager
- Allison Gibson, MPH, MCP, Project Coordinator
- Steve Melly, MS, MA, GIS Analyst
- Asma Sharaf, BS, MS (c), Graduate Research Assistant
- Ciara O’Sullivan, MPH (c), Graduate Research Assistant
- Isabel De Ramos, MS (c), Graduate Research Assistant
- Kristina Dureja, MS (c), Graduate Research Assistant
- Celina Koh, MPH, Graduate Research Assistant
- Alyssa Furukawa, MPH, Graduate Research Assistant
Contact
Edwin McCulley, Research Coordinator, emm387@drexel.edu
Funding provided by de Beaumont Foundation and Robert Wood Johnson Foundation.