
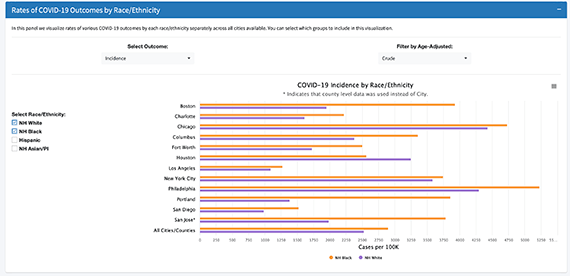
This figure shows cumulative rates of COVID-19 outcomes by race and ethnicity across cities. Here we see that in almost all cities displayed, non-Hispanic Blacks have a higher cumulative incidence rate than non-Hispanic whites.
Drexel University’s Urban Health Collaborative has partnered with the Big Cities Health Coalition (BCHC) to release the “COVID-19 Health Inequities in Cities Dashboard”. This dashboard is a powerful data tool that enables visualizations of COVID-19 related outcomes and inequities in COVID-19 related outcomes over time and across BCHC cities. The project was supported by the Robert Wood Johnson Foundation and the de Beaumont Foundation.
The dashboard aims to inform decision-making by public health leaders in BCHC cities and will educate the public, policymakers, and public health officials about the ways in which race/ethnicity, neighborhood, and city characteristics influence COVID-19 outcomes.
The dashboard includes information on COVID-19 incidence, mortality, testing, test positivity, and hospitalizations in BCHC cities. Additionally, the dashboard allows users to characterize, compare, and track inequities at three levels : across individuals within cities, across neighborhoods within cities, and across cities. Interactive visualizations allow users to explore data on COVID-19 related outcomes and outcome inequities for BCHC cities, including options for users to select specific variables or cities and tooltips to assist in interpretations.
The dashboard brings together data from several sources including data provided directly by the health departments as well as publicly available data.
The COVID-19 pandemic has highlighted the multiple ways that structural factors such as racism and economic inequality drive health inequities. Inequities in COVID-19 outcomes (testing, incidence, hospitalizations, and mortality) emerged early in the pandemic. A first step in addressing these inequities is to describe and quantify their magnitude in order to create public awareness and identify the factors and policies that may be most effective in eliminating them. Comparing inequities across different cities can be especially valuable in understanding drivers, targeting resources, and identifying effective policies.
View the dashboard here https://www.covid-inequities.info/.
The narrative brief accompanying the COVID-19 Health Inequities in Cities dashboard provides users with a summary of the project and includes details and instructions for users to best leverage the powerful data tools publicly available on the dashboard. View the brief here.