Housing Market Typology
By Diana Negron
November 2024
The U.S. housing market exhibits significant variations across Metropolitan Statistical Areas (MSAs). Understanding these variations at both national and local levels is crucial for policymakers and stakeholders. This report introduces a novel housing market typology that provides a comprehensive, data-driven approach to analyzing housing market characteristics across the country. This typology will highlight the geographic distribution of distinct housing market types, offering valuable insights for informed decision-making.
Recent trends highlight the urgency of addressing housing market disparities. While research from the Joint Center for Housing Studies of Harvard (2023) indicates a slowdown in home price growth and rent increases compared to 2022, these metrics remain elevated compared to pre-pandemic levels. This keeps homeownership out of reach for many, particularly due to high costs and rising interest rates. Consequently, a severe affordability crisis persists, with nearly half of renters and a significant number of homeowners spending an overwhelming portion of their income on housing. Low-income households and people of color are disproportionately impacted by this affordability burden. Additionally, a significant shortage of low-cost rental units and single-family homes exists, driven by factors like high construction costs, land prices, and regulatory barriers.
These discrepancies underscore the need for a comprehensive analysis of the diverse types of housing market characteristics and their implications for policy. A robust typology can inform housing development strategies, tailored affordable housing initiatives, and regional economic planning. It can also serve as a valuable tool for future housing market research. This combined typology approach provides a more nuanced and data-driven framework for understanding the complexities of the US housing market.
The urgent need for innovative housing solutions is echoed by the Nowak Metro Finance Lab. Our research highlights the systemic nature of the current housing crisis and the increasing efforts by states and localities to develop innovative solutions. To codify, replicate, and scale these solutions effectively, a National Housing Crisis Task Force was launched earlier this year by the lab. Cities are at the forefront of tackling housing challenges, but they also face severe obstacles due to the complex interplay between different levels of government.
The Housing Data Framework
This typology utilizes a multi-dimensional approach, encompassing factors that influence both housing demand and supply. It goes beyond traditional models by incorporating vulnerability and risk, housing market dynamics, and demographic and socioeconomic characteristics. This comprehensive approach acknowledges the significant variations in housing markets across different geographic regions.
Our typology is grounded in a comprehensive Housing Data Framework (Figure 1), which encompasses a wide range of variables measured at the Metropolitan Statistical Area (MSA) level. This framework allows us to capture the intricate interplay of factors shaping housing markets across the country.

Figure 1 MSA Housing Data Framework
The typology looks at data from 2013 – 2023, with a gap in 2020 (due to COVID-19 pandemic). The dataset contains 360 Metropolitan Statistical Areas so that there is a streamlined geographic consensus across all variables that were used. The clusters below in Figure 2 show the housing typology for the 360 metros.

Figure 2 MSA Housing Typology
The Five Housing Clusters
-
Smaller, Slower-Growth Markets: These markets, often metro areas anchored my smaller cities, exhibit slower growth rates and lower median household incomes. While they may offer more affordable housing options, they can face challenges in terms of economic development and attracting new residents and businesses.
-
Affluent, Expensive Markets: Characterized by high median household incomes, expensive housing, and strong economic centers, these markets are often major tech hubs and financial districts. They are established, economically powerful areas with high costs of living and significant barriers to entry for new residents and businesses.
-
Mid-sized, Moderate Growth Markets: These markets strike a balance between growth and affordability. With moderate growth rates and relatively affordable housing, they represent attractive options for both residents and investors.
-
Large, High-Growth Urban Markets: Major metropolitan areas experiencing significant growth, these markets have a high number of building permits and balanced development between single-family and multi-family housing. They are major economic centers with rapid expansion, presenting both opportunities and challenges in terms of housing supply and affordability.
-
Vacation/Retirement Markets: Dominated by Florida markets and other coastal areas, these markets attract retirees and vacationers. They have higher vacancy rates due to seasonal occupancy and a larger elderly population.
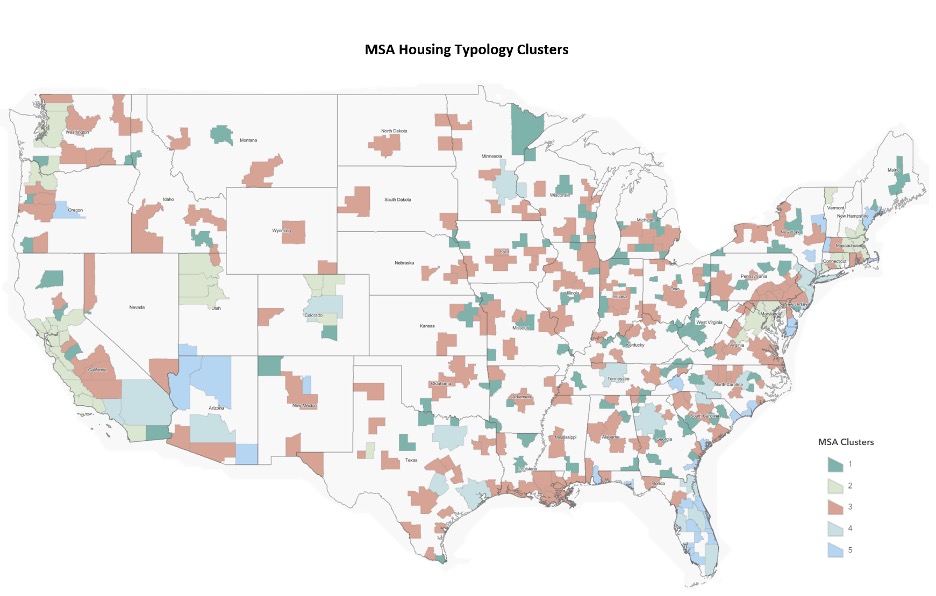
The map illustrates the geographical distribution of the five housing market clusters across the United States.

Figure 3 MSA Housing Typology Clusters
Coastal regions, particularly the East and West Coasts, are dominated by affluent, high-growth urban, and vacation/retirement markets (Clusters 2, 4, and 5). These areas often exhibit higher property values, economic opportunities, and natural amenities. In contrast, the Midwest and Mountain West regions are characterized by smaller, slower-growth and mid-sized, moderate-growth markets (Clusters 1 and 3), suggesting potential challenges related to economic development and population growth.
The map also underscores the stark contrast between coastal regions and inland areas. While larger urban centers are primarily clustered within Cluster 4 (Large, High-Growth Urban Markets), noncoastal areas are more likely to be categorized as Cluster 1 (Smaller, Slower-Growth Markets).
Our typology provides valuable insights into the diverse nature of the U.S. housing market. By understanding the unique characteristics of each cluster, policymakers, industry professionals, and researchers can make informed decisions and develop targeted strategies.
Home Values Across MSAs
This analysis delves into the trends of the Zillow Home Value Index (ZHVI) across Metropolitan Statistical Areas (MSAs) in the United States from 2013 to 2023. By categorizing MSAs into five distinct clusters, we aim to identify regional patterns and disparities in housing market performance.
The national ZHVI trend reveals a significant upward trajectory, particularly post-2020. This acceleration can be attributed to various factors, including historically low-interest rates, increased remote work, and shifts in housing preferences. However, a smaller increase in 2023 suggests a potential cooling of the market. The graph shows the ZHVI for 2013 is approximately $165,000 and the ZHVI for 2023 is around $325,000 across all MSAs. Therefore, the estimated increase in the average ZHVI nationwide for MSAs from 2013 to 2023 is $160,000, or nearly 100 percent.

Figure 4 Average ZHVI Over Time Across All MSAs
To gain deeper insights, we examined the performance of each cluster:
Cluster 1: Smaller, Slower-Growth Markets
Cluster 2: Affluent, Expensive Markets
Cluster 3: Mid-sized, Moderate Growth Markets
Cluster 4: Large, High-Growth Urban Markets
-
These markets experienced the highest growth rate of 125.31%, driven by factors such as job growth, population influx, and increased demand for urban living.
Cluster 5: Vacation/Retirement Markets
-
These markets also showed significant appreciation, with a growth rate of 124.92%. The strong performance can be attributed to factors like rising demand for second homes, retirement migration, and the allure of coastal and resort areas.
 Figure 5 ZHVI Growth Rate by Cluster (2013 - 2023)
Highest Growth Clusters
These nearly identical growth rates suggest strong demand in both primary urban centers and leisure destinations. This may be attributed to several factors:
-
Urban Appeal: Job growth, cultural amenities, and increased demand for urban living continue to drive growth in large urban markets.
-
Remote Work: The rise of remote work has allowed individuals to choose more desirable locations, including vacation and retirement destinations.
Mid-Tier Growth
This cluster maintained steady appreciation despite higher base values, suggesting continued demand in established wealthy areas. This may be due to wealth concentration effects and the resilience of high-end housing markets.
Lower-Growth Markets
-
Cluster 3 (Mid-sized, Moderate Growth Markets): 88.3%
-
Cluster 1 (Smaller, Slower-Growth Markets): 83.0%
These clusters experienced more modest appreciation, potentially due to:
-
Less Economic Diversification: Reliance on specific industries or sectors may limit growth potential.
-
Lower Migration Inflow: These areas may be less attractive to households from other U.S. regions compared to larger urban centers or desirable vacation destinations.
Understanding these regional disparities is crucial for policymakers, real estate professionals, and investors to make informed decisions and adapt to the evolving housing market landscape.
Construction Activity in the Clusters
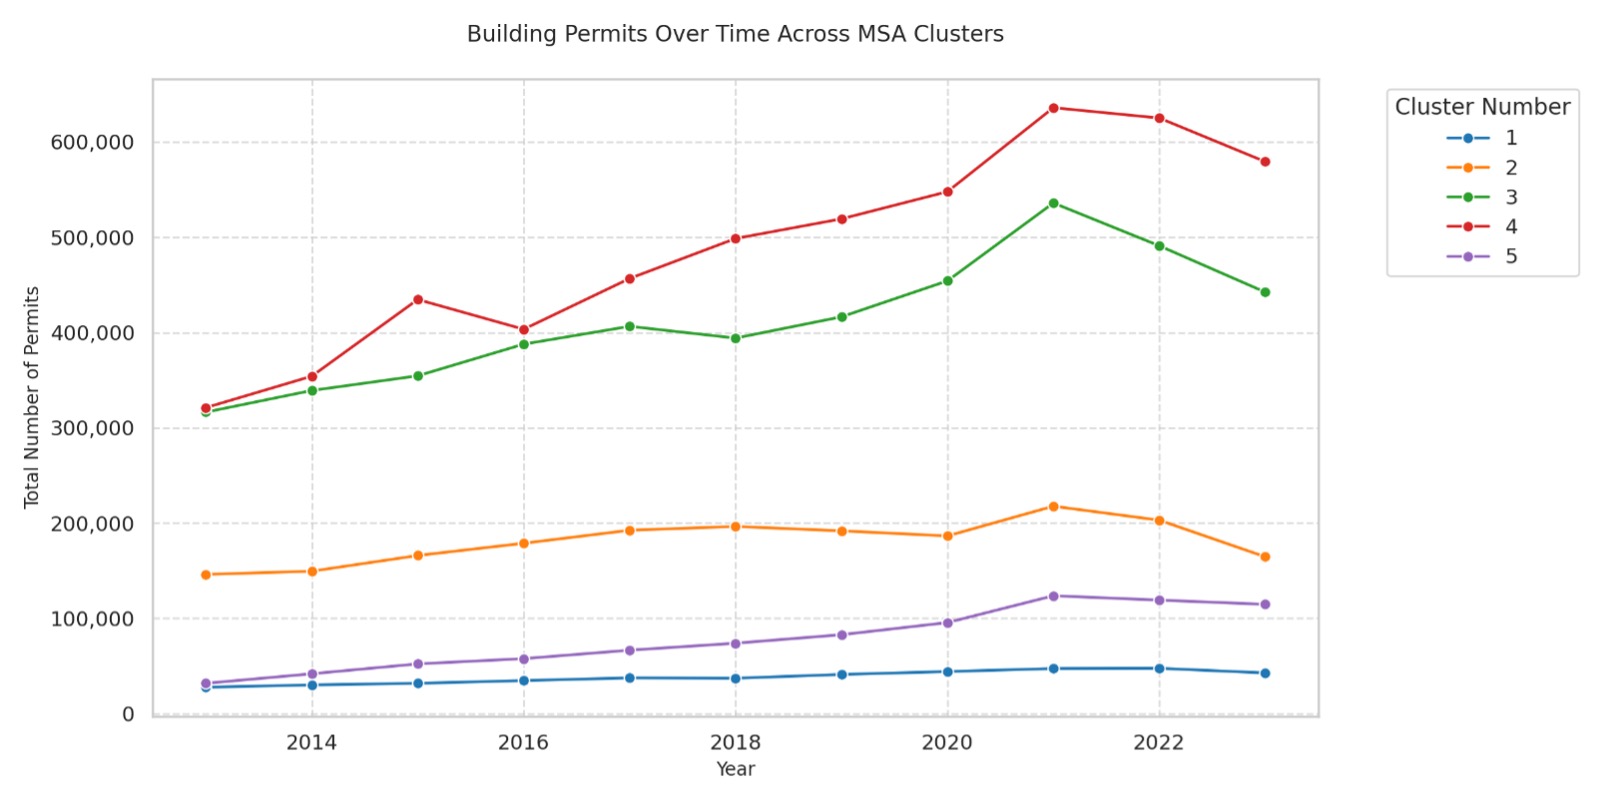
The graph provides a visual representation of the trend in building permits across different MSA clusters over time. Cluster 4, comprised of large, high-growth urban markets, consistently shows the highest number of building permits, indicating significant construction activity throughout the period. This aligns with the characteristics of these major metropolitan areas, which are experiencing rapid growth, high demand, and significant infrastructure development.
 Figure 6 Building Permits Across MSAs
Cluster 5, consisting of vacation and retirement markets, initially shows lower permit numbers but demonstrates a rapid increase towards the end of the period. This surge in construction activity could be linked to increased demand for second homes, retirement properties, and tourism-related developments.
Clusters 1, 2, and 3, representing smaller, slower-growth, affluent, and mid-sized markets, respectively, show more moderate increases in building permits. The slower growth in these clusters could be attributed to factors such as lower population growth, economic conditions, or zoning regulations.
Climate Change and MSAs
All clusters have been impacted differently from 2013 – 2023, however, with the reoccurring natural disasters, the risk of is greater than ever. The Federal Emergency Management Agency's (FEMA) National Risk Index (NRI) is a comprehensive tool designed to assess the risk of natural disasters across the United States. It considers a variety of factors, including the potential financial loss from disasters, the vulnerability of communities, and their ability to recover from such events. By providing a detailed analysis of risk at various geographic levels, the NRI empowers communities to prioritize mitigation efforts, allocate resources effectively, and develop robust emergency plans. This valuable tool helps to enhance preparedness, reduce vulnerability, and build resilience in the face of natural disasters.
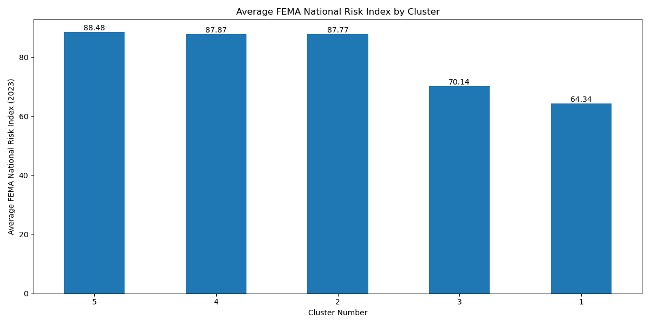
The bar chart presents the average FEMA National Risk Index (NRI) for each of the five housing clusters in 2023.

Figure 7 Average FEMA National Risk Index by Cluster
All scores are constrained to a range of 0 to 100. The higher the score is close to 100 the higher a greater risk of natural hazards. The range of 0-33 is low risk, 34-66 moderate risk, and 67-100 is high risk. The average score across all MSAs is 72.66 putting them at high risk.
Clusters 5 and 4, composed of regions highly susceptible to natural hazards, exhibit the highest NRI scores. This indicates a greater likelihood of experiencing severe natural disasters and facing significant challenges in recovery efforts. In contrast, Clusters 1 and 3, which may encompass regions with less severe natural hazards or stronger infrastructure, demonstrate lower NRI scores.
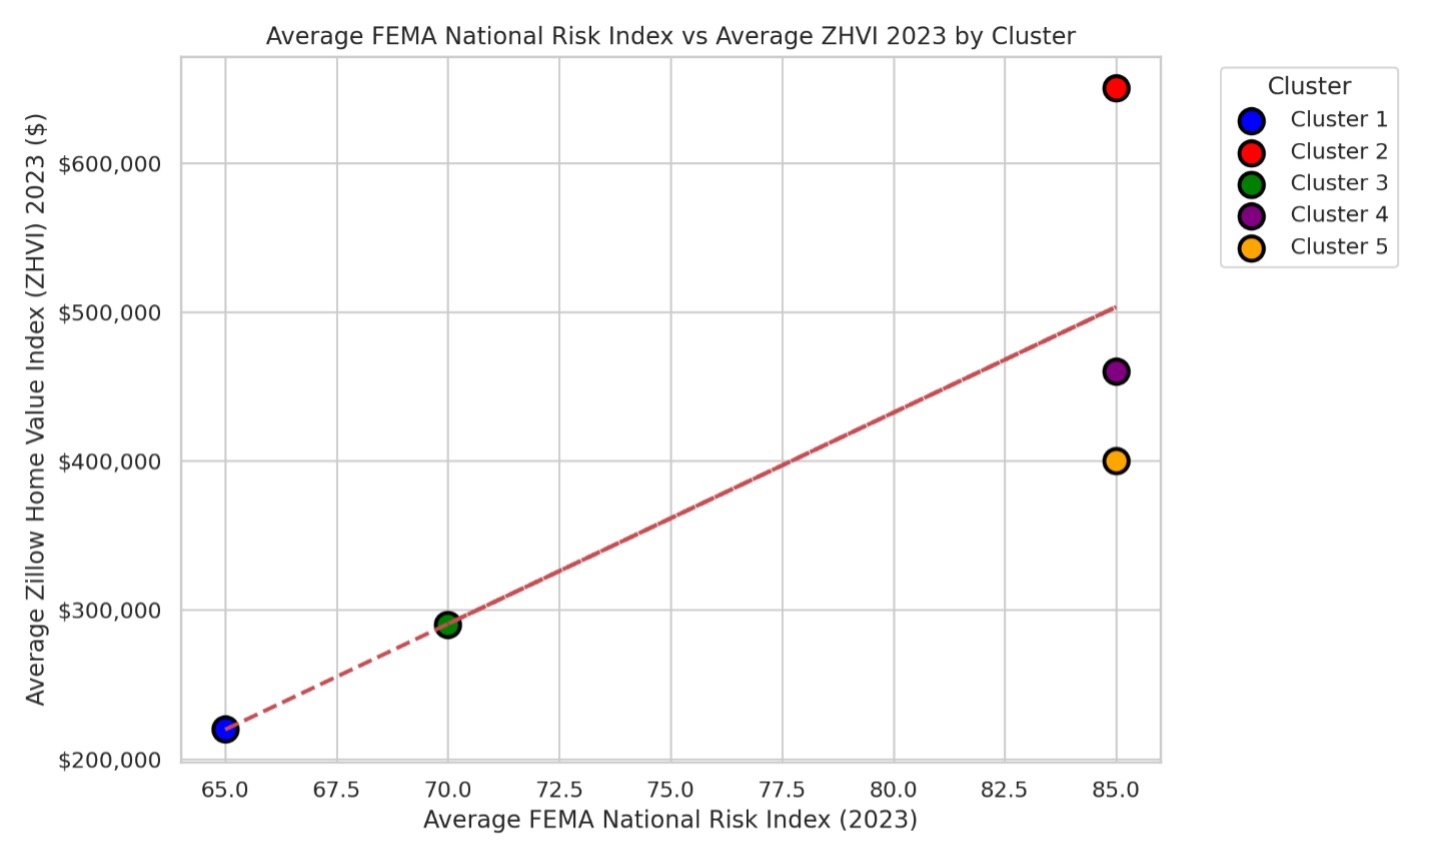
To further explore the relationship between housing market value and natural hazard risk, we analyzed the average FEMA National Risk Index and the average Zillow Home Value Index by Cluster for 2023.
 Figure 8 Average FEMA National Risk Index vs Average ZHVI by Cluster
The cluster-specific analysis highlighted the following:
-
Cluster 1 (Smaller, Slower-Growth Markets): These markets generally have lower ZHVI values and lower NRI scores, suggesting they are located in areas with lower natural hazard risks.
-
Cluster 2 (Affluent, Expensive Markets): These markets exhibit high ZHVI values across a range of NRI scores, indicating that high-value markets can be found in both high- and low-risk areas.
-
Cluster 3 (Mid-sized, Moderate Growth Markets): This cluster represents a middle ground, with moderate ZHVI values and a moderate NRI score.
-
Clusters 4 and 5 (Large High-Growth Urban and Vacation/Retirement Markets): These clusters show a mix of ZHVI values and high NRI scores. This suggests that large urban areas and popular vacation destinations are often located in regions with significant natural hazard risks.
The cluster emphasize a need for risk mitigation but also the potential financial value of a property and its exposure to natural hazards, aiding in making informed decisions about where to live, work, and invest.
Conclusion
This report has presented a novel housing market typology that provides a comprehensive, data-driven approach to analyzing housing market characteristics across the United States. By categorizing MSAs into five distinct clusters, we have gained valuable insights into the diverse nature of the U.S. housing market.
Our analysis reveals significant regional disparities in housing market performance, with urban and coastal markets generally outperforming smaller, slower-growth markets. The COVID-19 pandemic has further accelerated these trends, particularly in terms of remote work and shifting housing preferences.
While the housing market has experienced substantial growth, challenges remain, including affordability issues, particularly in high-demand areas, and the need for sustainable and equitable housing development. It is imperative to address the growing housing affordability crisis and ensure that housing remains accessible and affordable for all.
Diana Negron was as a Graduate Research Analyst at the Nowak Metro Finance Lab in 2024. She is a doctoral student in City and Regional Planning at the University of Pennsylvania Weitzman School of Design and a Fontaine Society Fellow.