World Water Day 2022 – A long way to go towards achieving equitable access to water and sanitation in Latin American cities
Posted on
March 22, 2022
By: Claire Slesinski and Katy Indvik
SALURBAL Project
“Leaving no one behind” was the theme of World Water Day 2019. A report launched by UN-Water to commemorate the day focused on “how improvements in water resources management and access to water supply and sanitation services are essential to addressing various social and economic inequities, such that ‘no one is left behind’ when it comes to enjoying the multiple benefits and opportunities that water provides.” The report also noted that “65% of the population of Latin America and the Caribbean had access to safely managed drinking water services,” that 86% of the population has access to at least a basic sanitation service, and that access to these resources is “significantly lower in rural areas than in urban areas.”
While this report suggests that equitable access to basic water services and basic sanitation in Latin American cities is fairly good, a closer look at the available data reveals that some urban communities are in fact being almost completely left behind.
It is widely known that access to basic water and sanitation services has profound implications for health outcomes across the life course, especially during the earliest years of life. Within the SALURBAL project, we have found that better water and sanitation access is associated with lower levels of infant and maternal mortality, increases in life expectancy, and a smaller proportion of deaths related to infectious and communicable diseases among people of all ages. (Ortigoza et al, 2020; Bilal et al, 2021)
SALURBAL’s data on water and sanitation
The SALURBAL project has compiled census data from 371 cities in 11 countries in Latin America, allowing researchers to understand inequities in health outcomes as well as environmental features that could be causing these inequities.
Using a method called “harmonization,” the project has matched census questions across these 11 countries to create shared variables. This allows for direct comparisons across the 371 cities and 1,436 “sub-cities” (city sub-sections) included in the project. Our data set includes information on five important indicators of water and sanitation access:
- Access to piped water from any source. The proportion of households at the entire-city or sub-city level with access to piped water. Piped water may include water inside of the house, on the same property as the house, or outside the house and property as long as the water is piped. The water connection may also be exclusive or shared between households.
- Access to any water source inside of their house. The proportion of households at the entire-city or sub-city level with access to any water source inside of the house or dwelling. This could be piped water, water from another type of aqueduct of any kind, or from a well located inside of their house.
- Access to water from a municipal public or private water network. The proportion of households at the entire-city or sub-city level with access to water from a municipal or private water network. This would exclude water sourced from wells, rivers, or other bodies of naturally occurring water, or water delivery trucks.
- Connection to a sewage system. The proportion of households at the entire-city or sub-city level with connection to a sewage system. A sewage system could be a municipal sewage system, a privately operated sewage system, or a septic tank located on or near the household’s property. Pit latrines and disposal of waste in natural bodies of water or by some other method are not considered to be connections to a sewage system.
- Connection to a sewage network. The proportion of households at the entire-city or sub-city level with a connection to a sewage network. This includes only households that are connected to a municipal sewage system or a privately operated sewage system and doesn’t include households that are connected to a septic tank.
Hidden disparities in access
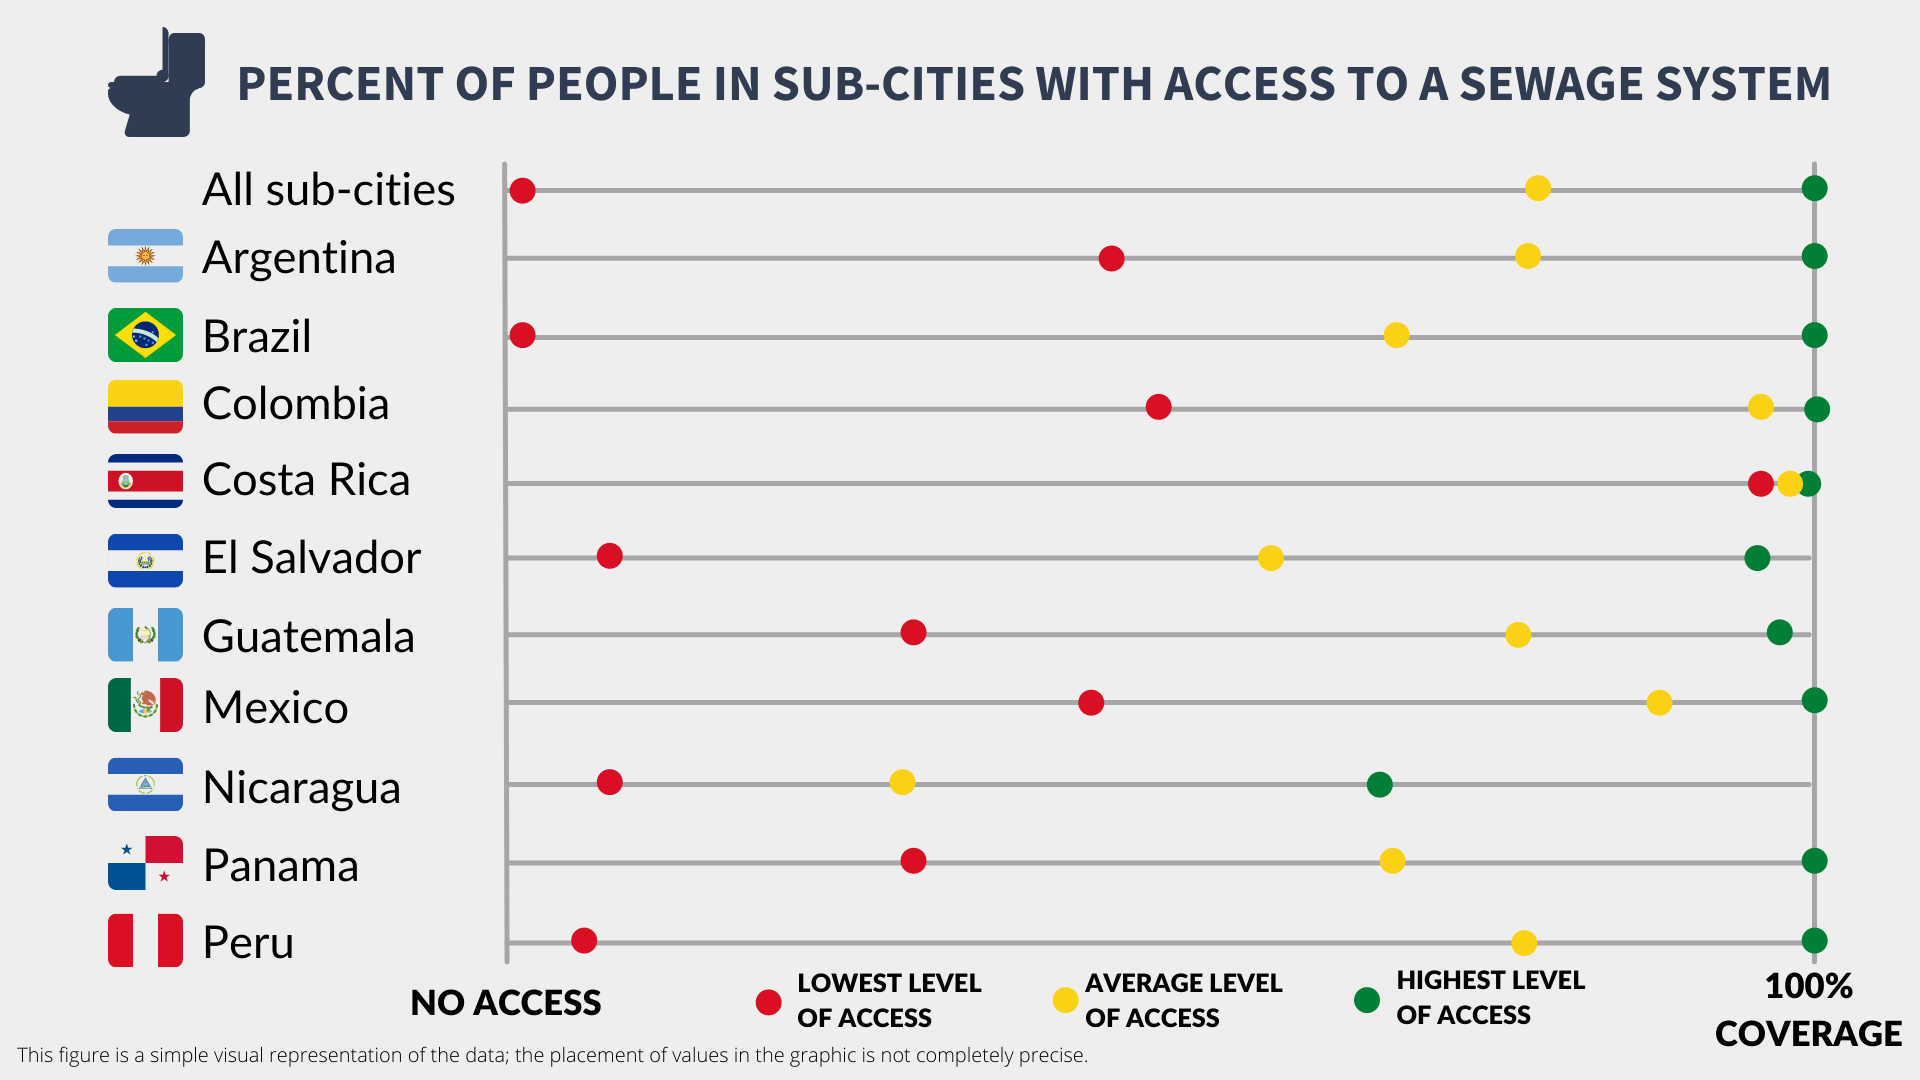
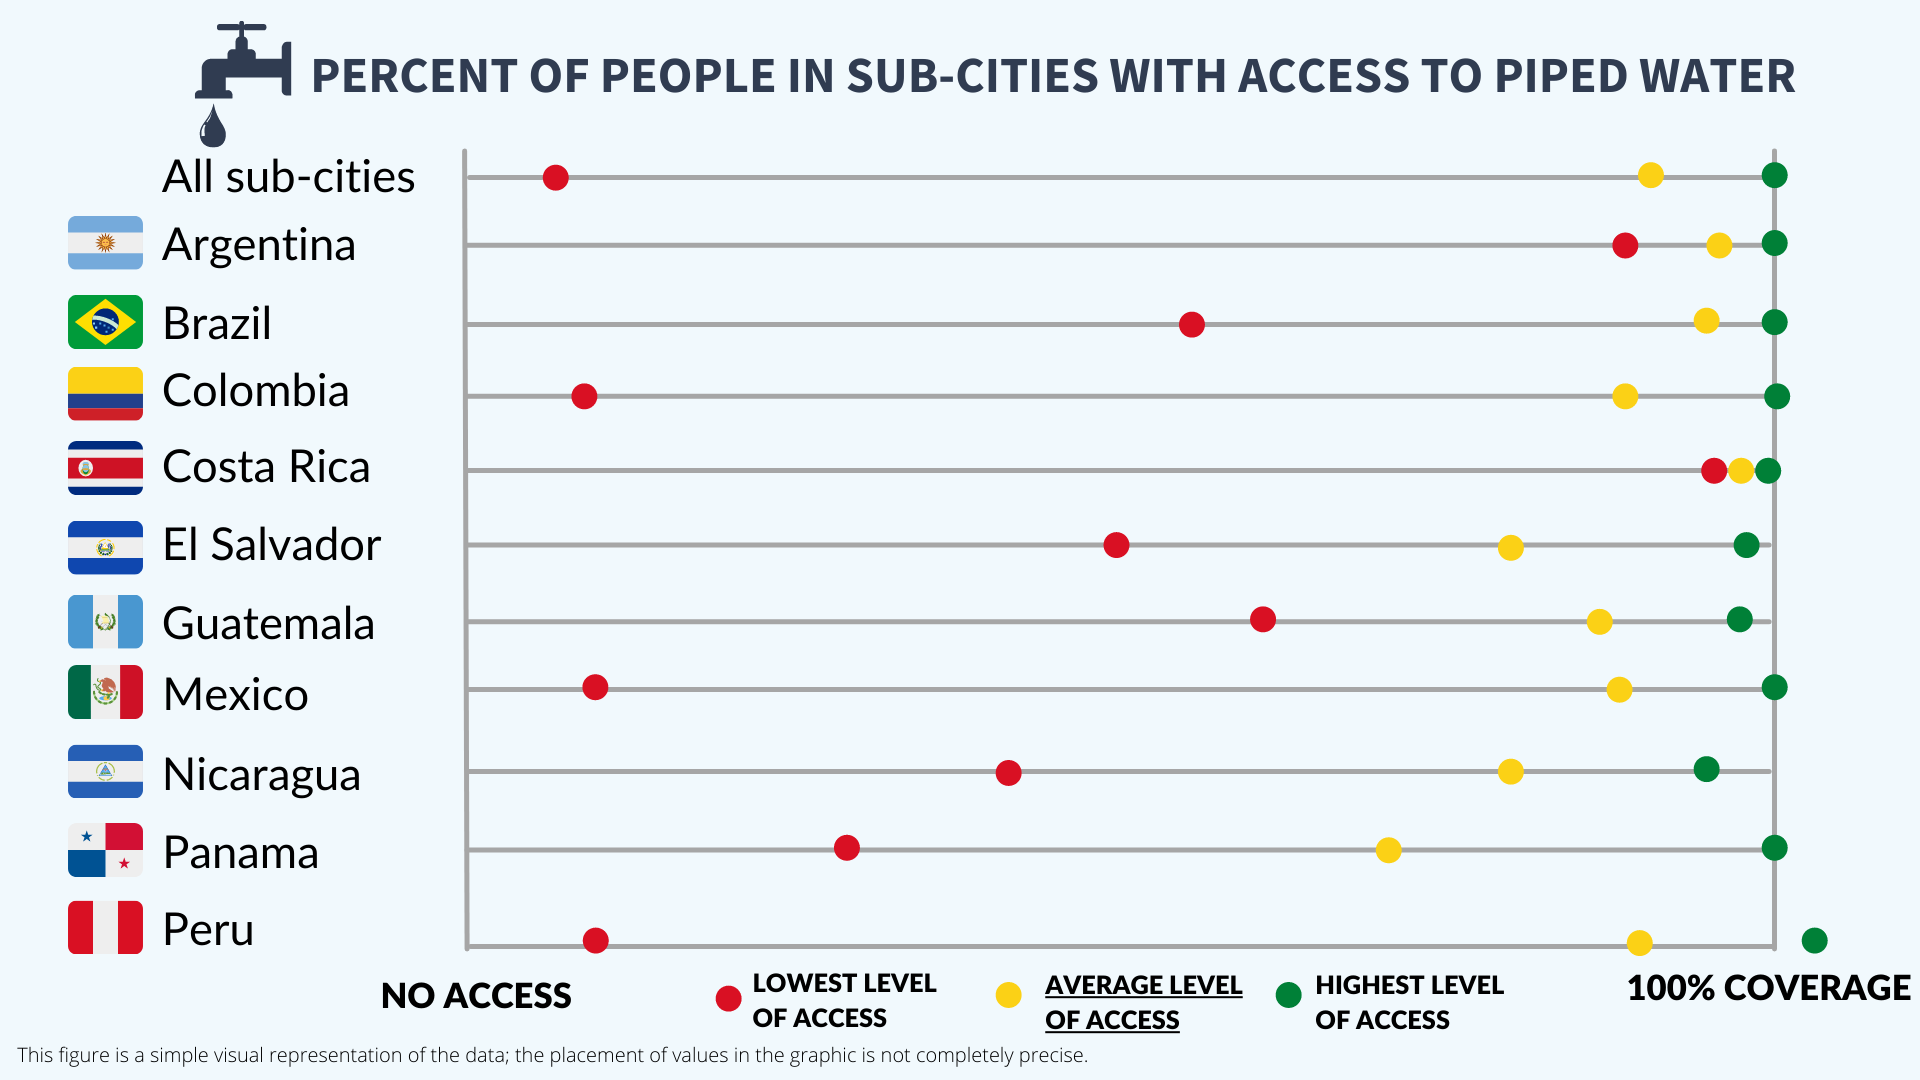
Looking at SALURBAL’s data for all cities, one might think that access to water and sanitation in Latin America isn’t such a big problem. About 95% of the population of 350 of SALURBAL’s cities have access to piped water, and 84% have access to a sewage system. However, looking more deeply into the data, important differences in access to piped water and sewage systems emerge.
If we look across all SALURBAL sub-cities for which this data is available, on average, 82% of the population at the sub-city level have access to a sewage system of any type. However, access levels range from 1% to 100%. This means that there are sub-cities in these countries where only 1% of households have access to a sewage system of any type, and other sub-cities where 100% of households have access. You can see a visual representation of this data and the data for all countries below.
Similarly, on average, 93% of the population at the sub-city level have access to piped water. But when we look at the range of access levels, we can see that in some sub-cities the coverage of piped water is as low as 7% of households, while in other sub-cities, 100% of households have access to piped water.
These graphics are not precise visualizations of the data, they are only intended to help us understand the diversity in and inequity of access across countries and sub-cities. If you want to see the exact numbers for these and other water and sanitation indicators, you can download them here. Note that Chile doesn’t ask these questions in their census, so their 21 cities are not included. Also note that data from Mexico’s 2010 census is included even though they conducted a 2020 census because 2020 data isn’t ready for use quite yet.
While Chile, Mexico, Colombia, Guatemala, and Peru have all done a census within the past five years, Argentina, Brazil, Costa Rica, El Salvador, Nicaragua, and Panama have not – some of them were scheduled to occur in 2020 but were delayed due to the COVID-19 pandemic. It’s possible that once we have access to more recent data, a different picture will emerge.
Future challenges
Even in urban areas that currently have access to water and sanitation, climate change will continue to create important challenges. Extreme weather events like storms and floods damage critical infrastructure, and long-term shifts in precipitation patterns are creating water scarcity and threatening the sustainability and reliability of sanitation systems in many cities. These challenges, together with other impacts of climate change like extreme heat, will drive increases in food and water-borne illness, infectious disease, and food and water insecurity.
So, what can we do?
The insight provided by SALURBAL about sub-city differences can help urban planners and policymakers identify the places that are most in need of infrastructure improvements and may be the most vulnerable – both today and in the face of projected climate change. Understanding inequities in access across and within cities helps direct and prioritize investment and can also help urban areas set concrete goals and assess progress.
Without a doubt, substantial improvements to water and sanitation access across Latin America can be highlighted, and progress is worth celebrating. Nevertheless, we need to continue to look for the people and places that remain excluded from our urban systems – and to fight for the policies and changes that will come closer to truly leaving no one behind.