COVID-19 Health Inequities Dashboard adds Vaccination Coverage for Different Age Groups
October 4, 2021
Earlier this year researchers from Drexel’s Urban Health Collaborative launched the COVID-19 Health Inequities in Cities dashboard that allows users to characterize and track COVID-19 outcomes and inequities in COVID-19 outcomes over time across multiple levels: across subgroups of individuals within cities, across neighborhoods within cities, and across cities.
The dashboard has recently been updated to include two new features that leverage data on COVID-19 vaccination outcomes by age. The first new feature shows city-specific inequities by age group and can be found under the City Report: Vaccination Inequities section of the dashboard. The “inequities by age group” allows users to compare the COVID-19 vaccination outcomes listed below by meaningful age groups.
COVID-19 Vaccination Outcomes
- Fully vaccinated: percent of the total population that has been fully vaccinated (taking into consideration the number of doses required for each vaccine).
- Partially vaccinated: percent of the total population that has been only partially vaccinated (e.g., one dose of an mRNA-based vaccine).
- At least partially vaccinated: percent of the total population that has been either partially or fully vaccinated.
Figure 1 (below) shows that the percent of fully vaccinated seniors (ages 65 and older) in San Diego, CA, is 17.4 percentage points higher compared to the overall percent fully vaccinated. It also shows that the 0-11 group has a 0% vaccination rate, which is to be expected given that none of the current vaccines have been authorized for use in this group.
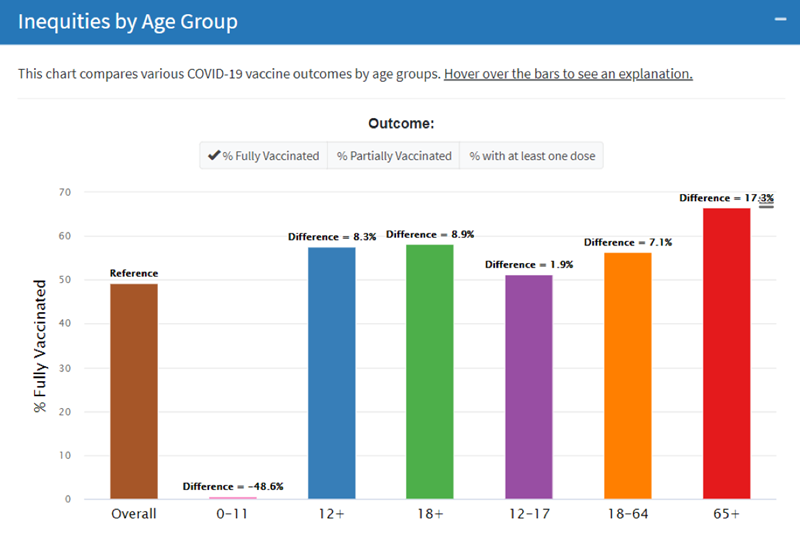
Figure 1. Vaccination Inequities by Age Group in San Diego, CA
The second new feature is located in the Vaccination Inequities Across Cities section of the dashboard and offers the opportunity to explore, compare and contrast COVID-19 vaccination coverage, and inequities in COVID-19 vaccination outcomes by age groups across several US cities. The vaccination outcomes employed by this feature includes the above COVID-19 vaccination outcomes plus doses per capita which is defined as the total number of administered vaccine doses per 1000 individuals.
Figure 2 (below) allows users to compare differences in the percent of the population ages 65 and older that are fully vaccinated across US cities.
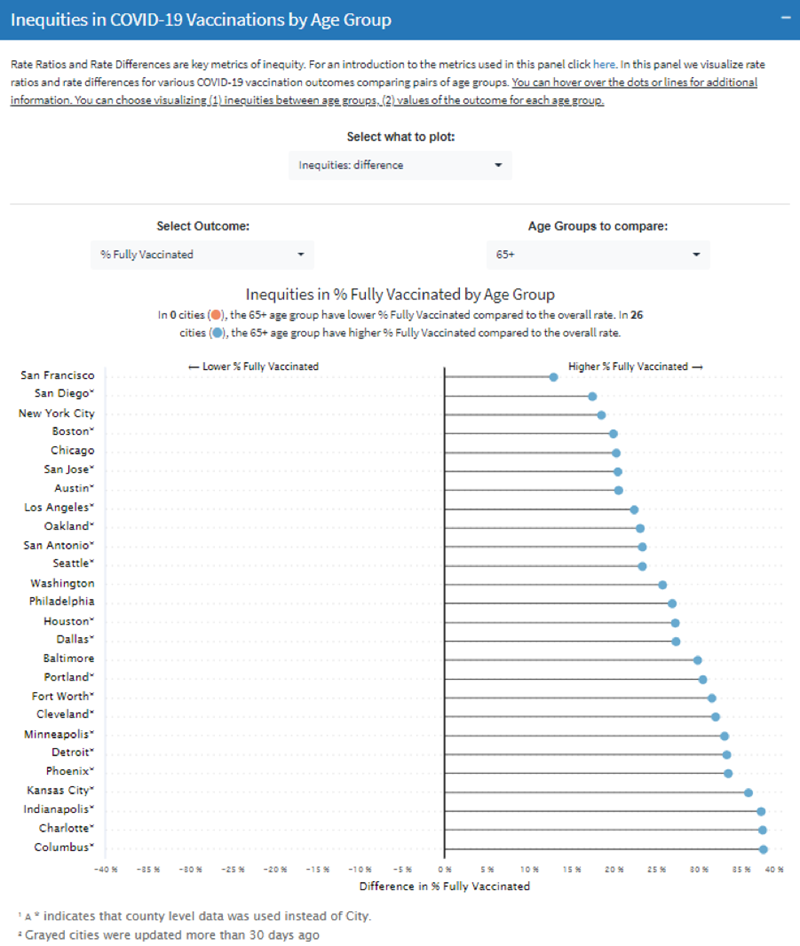
Figure 2. Comparing Inequities in COVID-19 Vaccinations by Age Group (65+ shown) Across Cities
Figure 3 shows COVID-19 vaccination coverage by age group. This shows that the percent of fully vaccinated seniors (ages 65 and older) is higher in San Francisco, CA (85.8%) compared to San Diego, CA (66.5%).
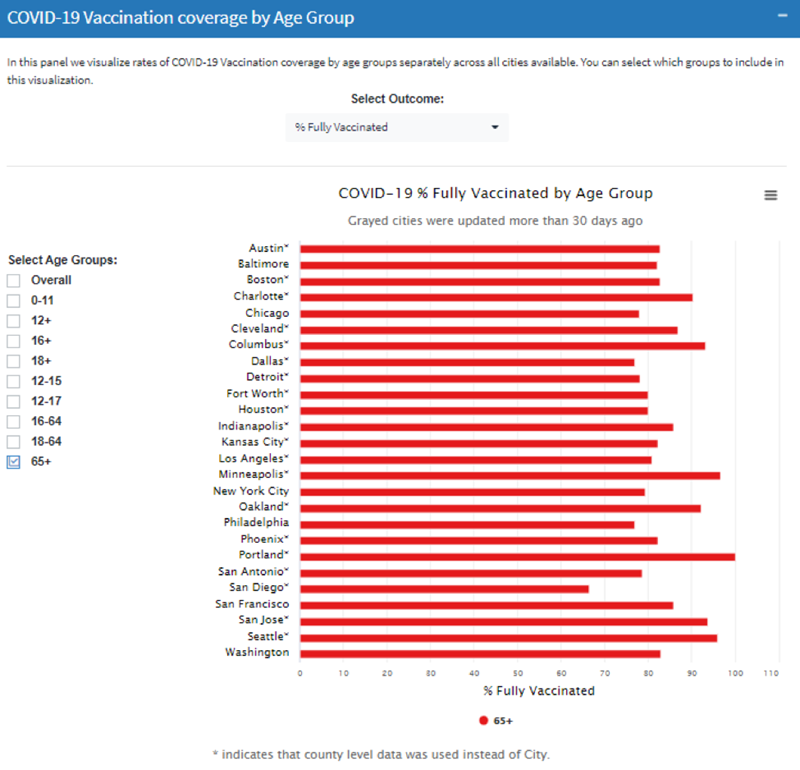
Figure 3. Comparing COVID-19 Vaccination Coverage for Ages 65+ Across Cities
In response to the ongoing pandemic, tracking and characterizing inequities in COVID-19 vaccination outcomes can be instrumental in developing interventions and policies to increase COVID-19 vaccination coverage, especially in underserved or vulnerable populations.
The dashboard will continue to provide the most up to date COVID-19 data. Explore the dashboard to better understand the COVID-19 pandemic from an urban health perspective. This project is conducted in collaboration with the Big Cities Health Coalition and is funded by the Robert Wood Johnson Foundation.