Creating the Investment Prospectus for Your City
Section 6: Your City by the Opportunity Zones
This section of the Prospectus explores the specific characteristics of the Opportunity Zones themselves, giving both a general overview of the zones compared to their larger municipal context as well as drill-downs into the zones or zone groupings. The drill-downs highlight select data points, recent investments and potential investments in the opportunity zone.
Opportunity Zone Overview
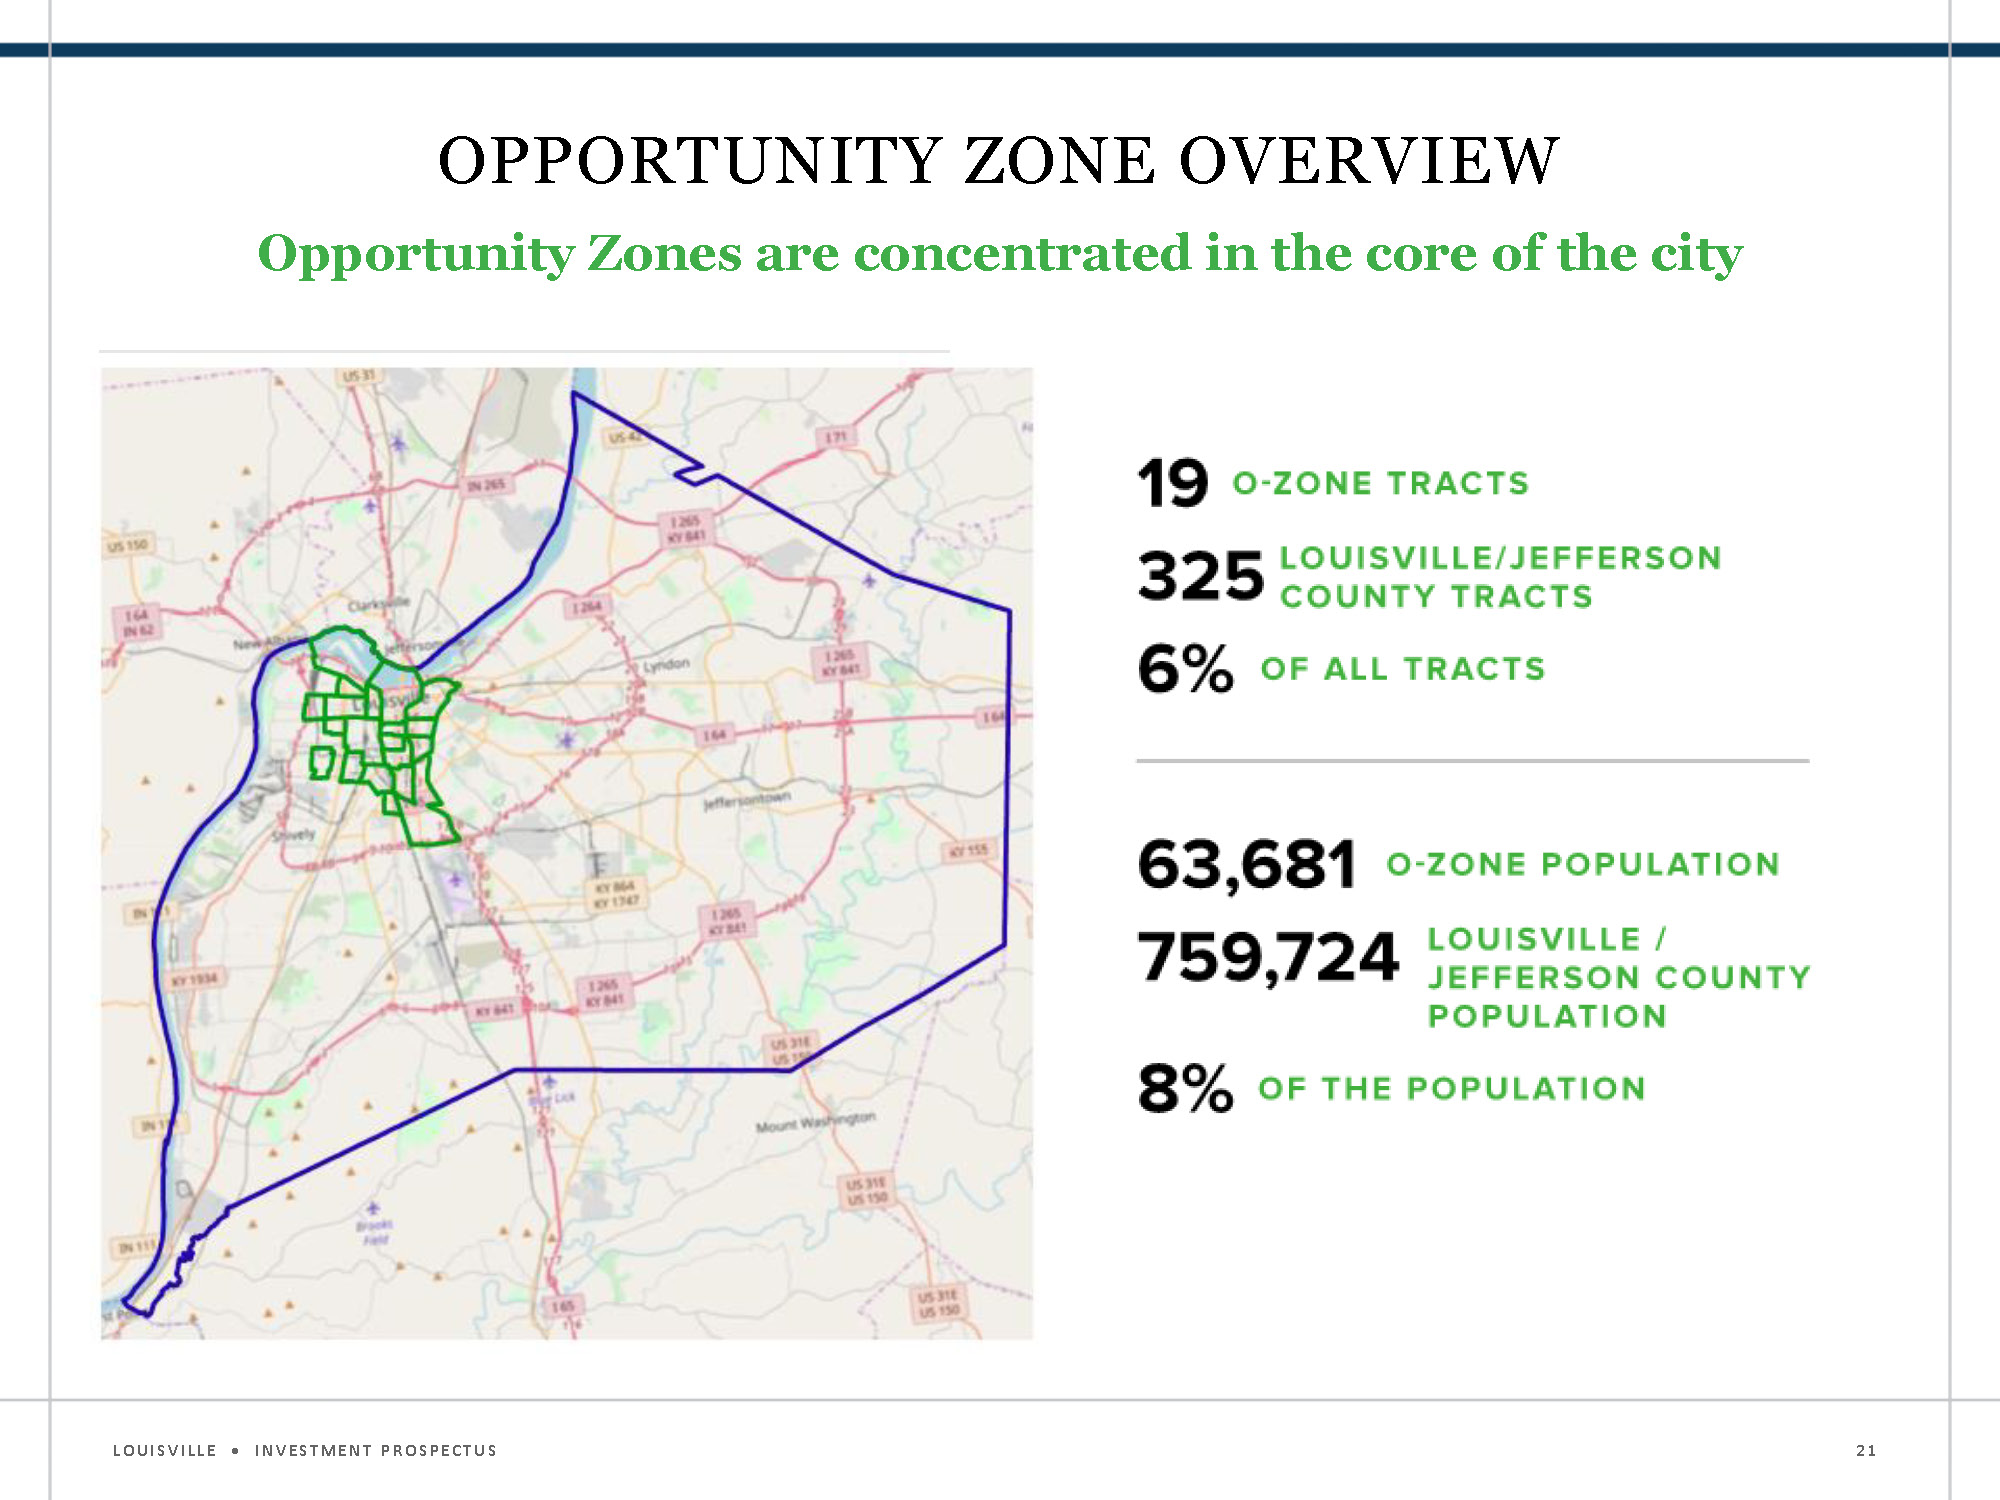
Opportunity Zones are concentrated in the core of the city
- 19 o-zone tracts
- 325 Louisville/Jefferson County Tracts
- 6% of all tracts
- 63,681 o-zone population
- 759,724 Louisville/Jefferson County Population
- 8% of the population
Opportunity Zones General Overview
The overview should summarize the the scale of opportunity zones in your municipality in terms of total population, census tracts, and Opportunity Zone tracts. As with the “Introduction to Your City” section, this data is publicly available from the Census Bureau’s American FactFinder app, although tools such as PolicyMap or other online mapping applications may make it easier to perform the aggregation calculations for multiple tracts for this and many of the following sections.
Opportunity Zones Socio-Economic Overview
As with the overview, this section compares key socio-economic data within Opportunity Zones (in the aggregate) to the US, State, Metro, and City. The slide to the right illustrates the various characteristics that are relevant to Louisville’s Opportunity Zones, focusing on incomes, employment, poverty, and educational attainment.
|
Black |
Hispanic |
Foreign Born |
Poverty |
Median Household Income |
% ED BA+ |
% Some College |
% No HS Degree |
% Under 18 |
% Over 65 |
Unemployment |
| Metro |
14% |
4% |
5% |
14% |
$52,437 |
28% |
31% |
11% |
23% |
14% |
3.4% |
| City |
21% |
5% |
7% |
17% |
$50,099 |
32% |
30% |
11% |
23% |
15% |
3.6% |
| O-Zones |
54% |
2% |
7% |
43% |
$21,713 |
15% |
32% |
21% |
22% |
15% |
N/A |
| State (KY) |
8% |
3% |
4% |
19% |
$44,811 |
23% |
29% |
15% |
23% |
15% |
3.9% |
| US |
13% |
17% |
13% |
15% |
$55,322 |
30% |
29% |
15% |
23% |
15% |
4.1% |
Opportunity Zone Groups
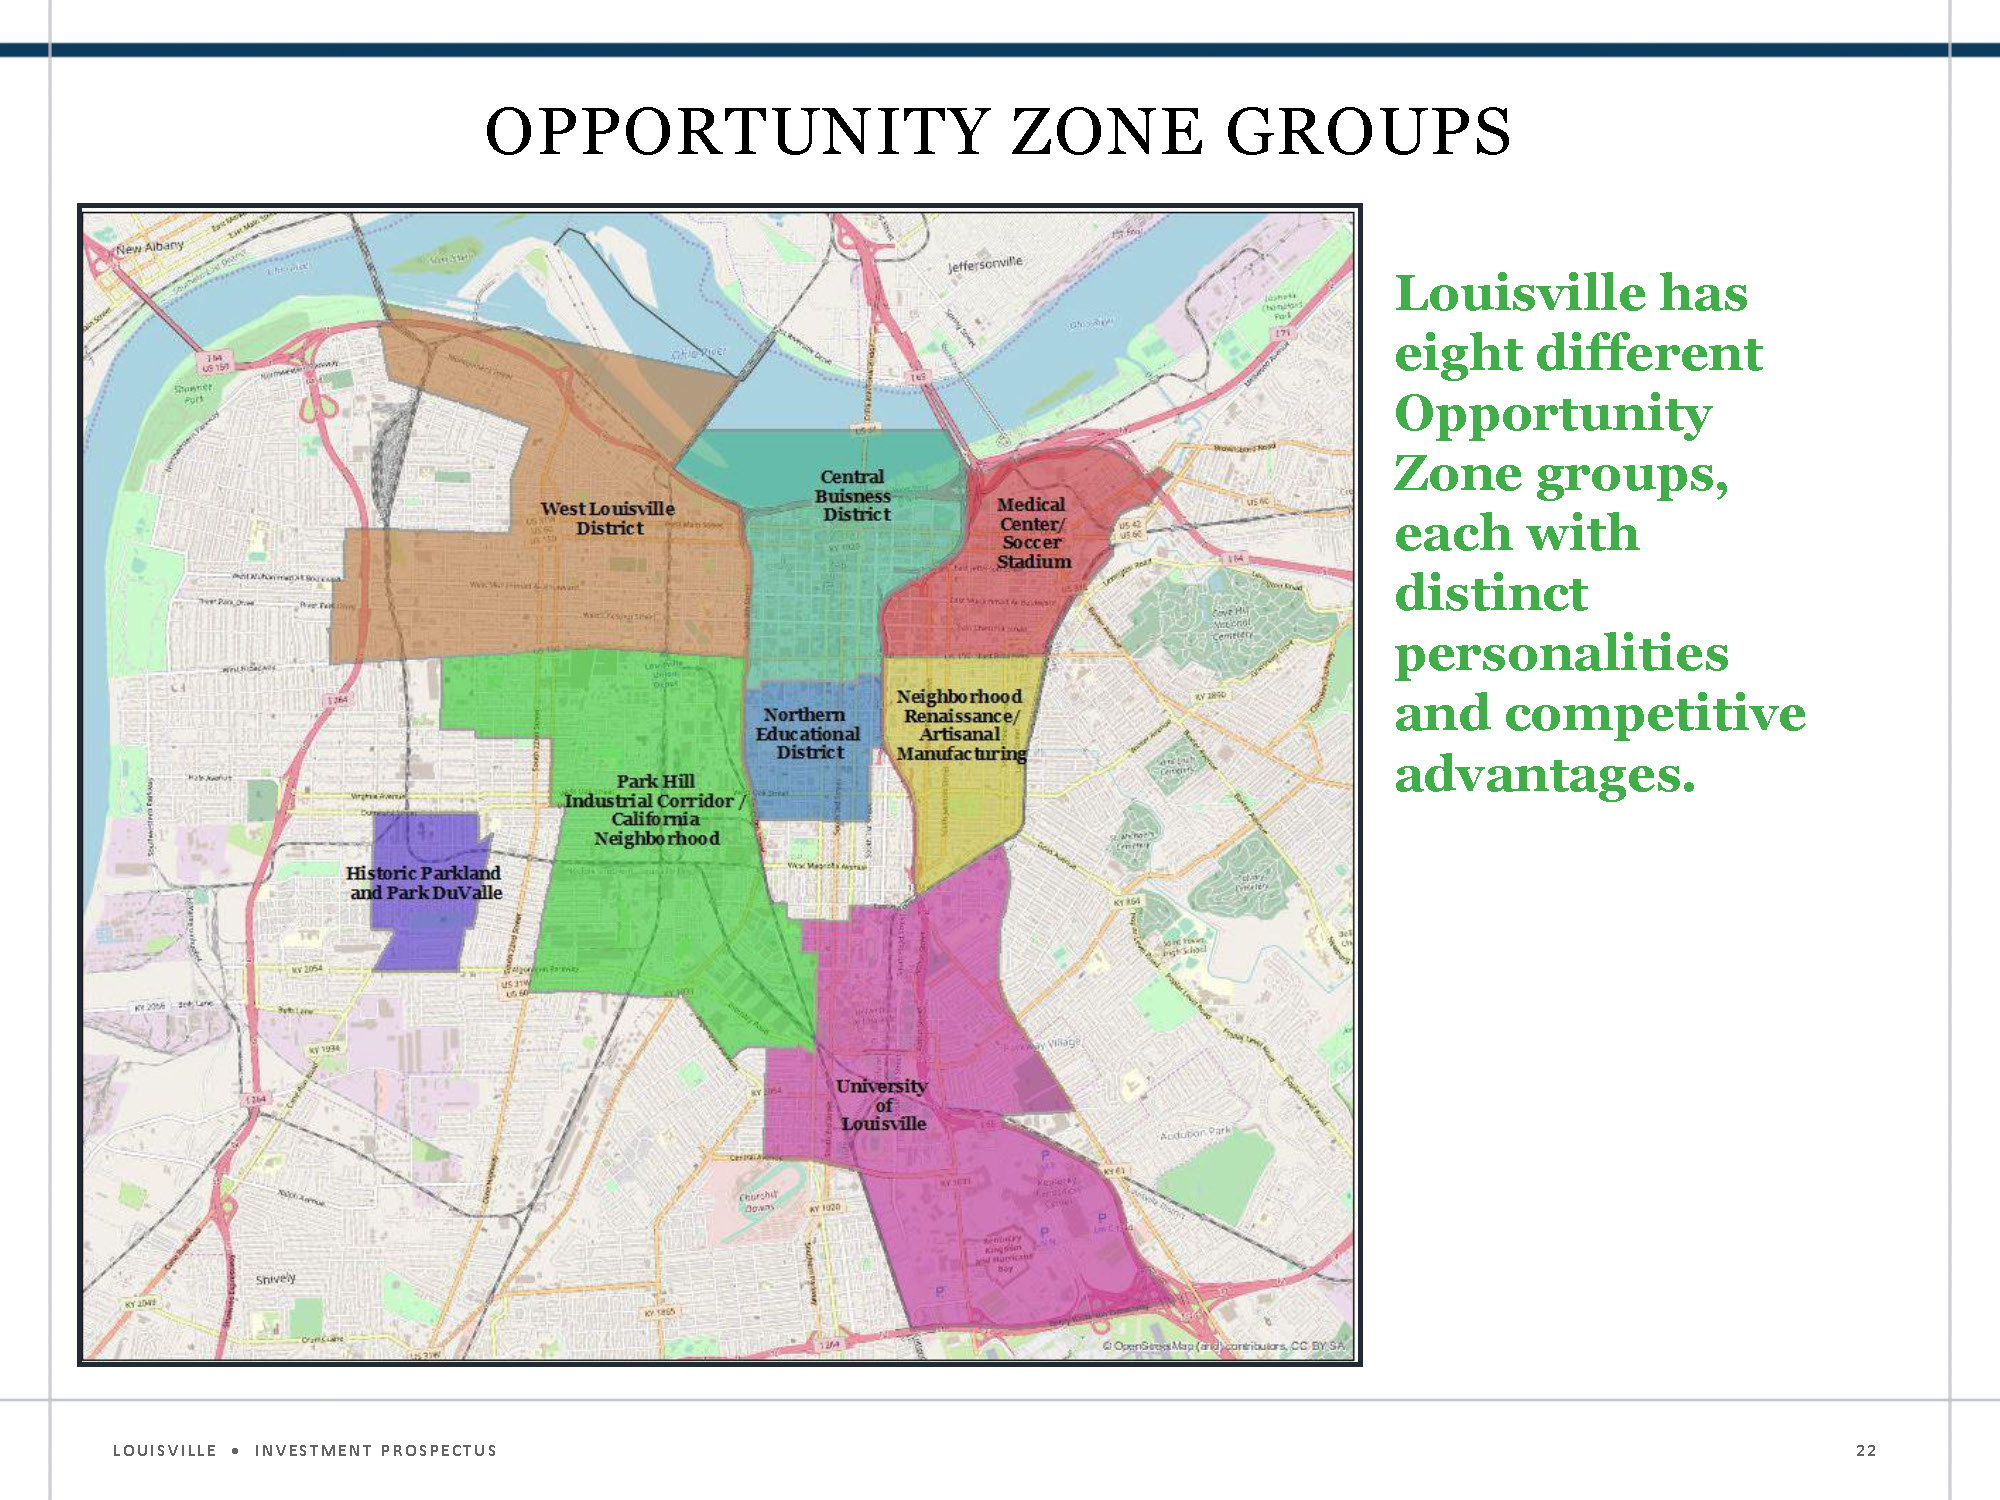
Louisville has eight different Opportunity Zone groups, each with distinct personalities and competitive advantages
Opportunity Zone Mental Map
The slide to the right depicts what is referred to as an Opportunity Zone mental map. It depicts the combination of designated tracts into meaningful geographic groupings that have market integrity given their shared socio-economic demographics, land use, and assets. This allows for a more strategic summary and marketing of the areas. The mental map should be created through discussions among public, private, and civic sector leaders and driven by quantitative evidence as well as qualitative knowledge and expertise.
Examples from Louisville area mental maps are seen below to demonstrate how your city can convey a sense of district-wide organizing elements and place to make connections for investors between assets and potential. Note that because mental maps represent true market areas rather than administrative census tracts, cities will need to aggregate data for multiple census tracts to show the full assets of the Opportunity Zone. PolicyMap’s customized region tool and their community report function makes it easy to obtain this aggregate data.
West Louisville
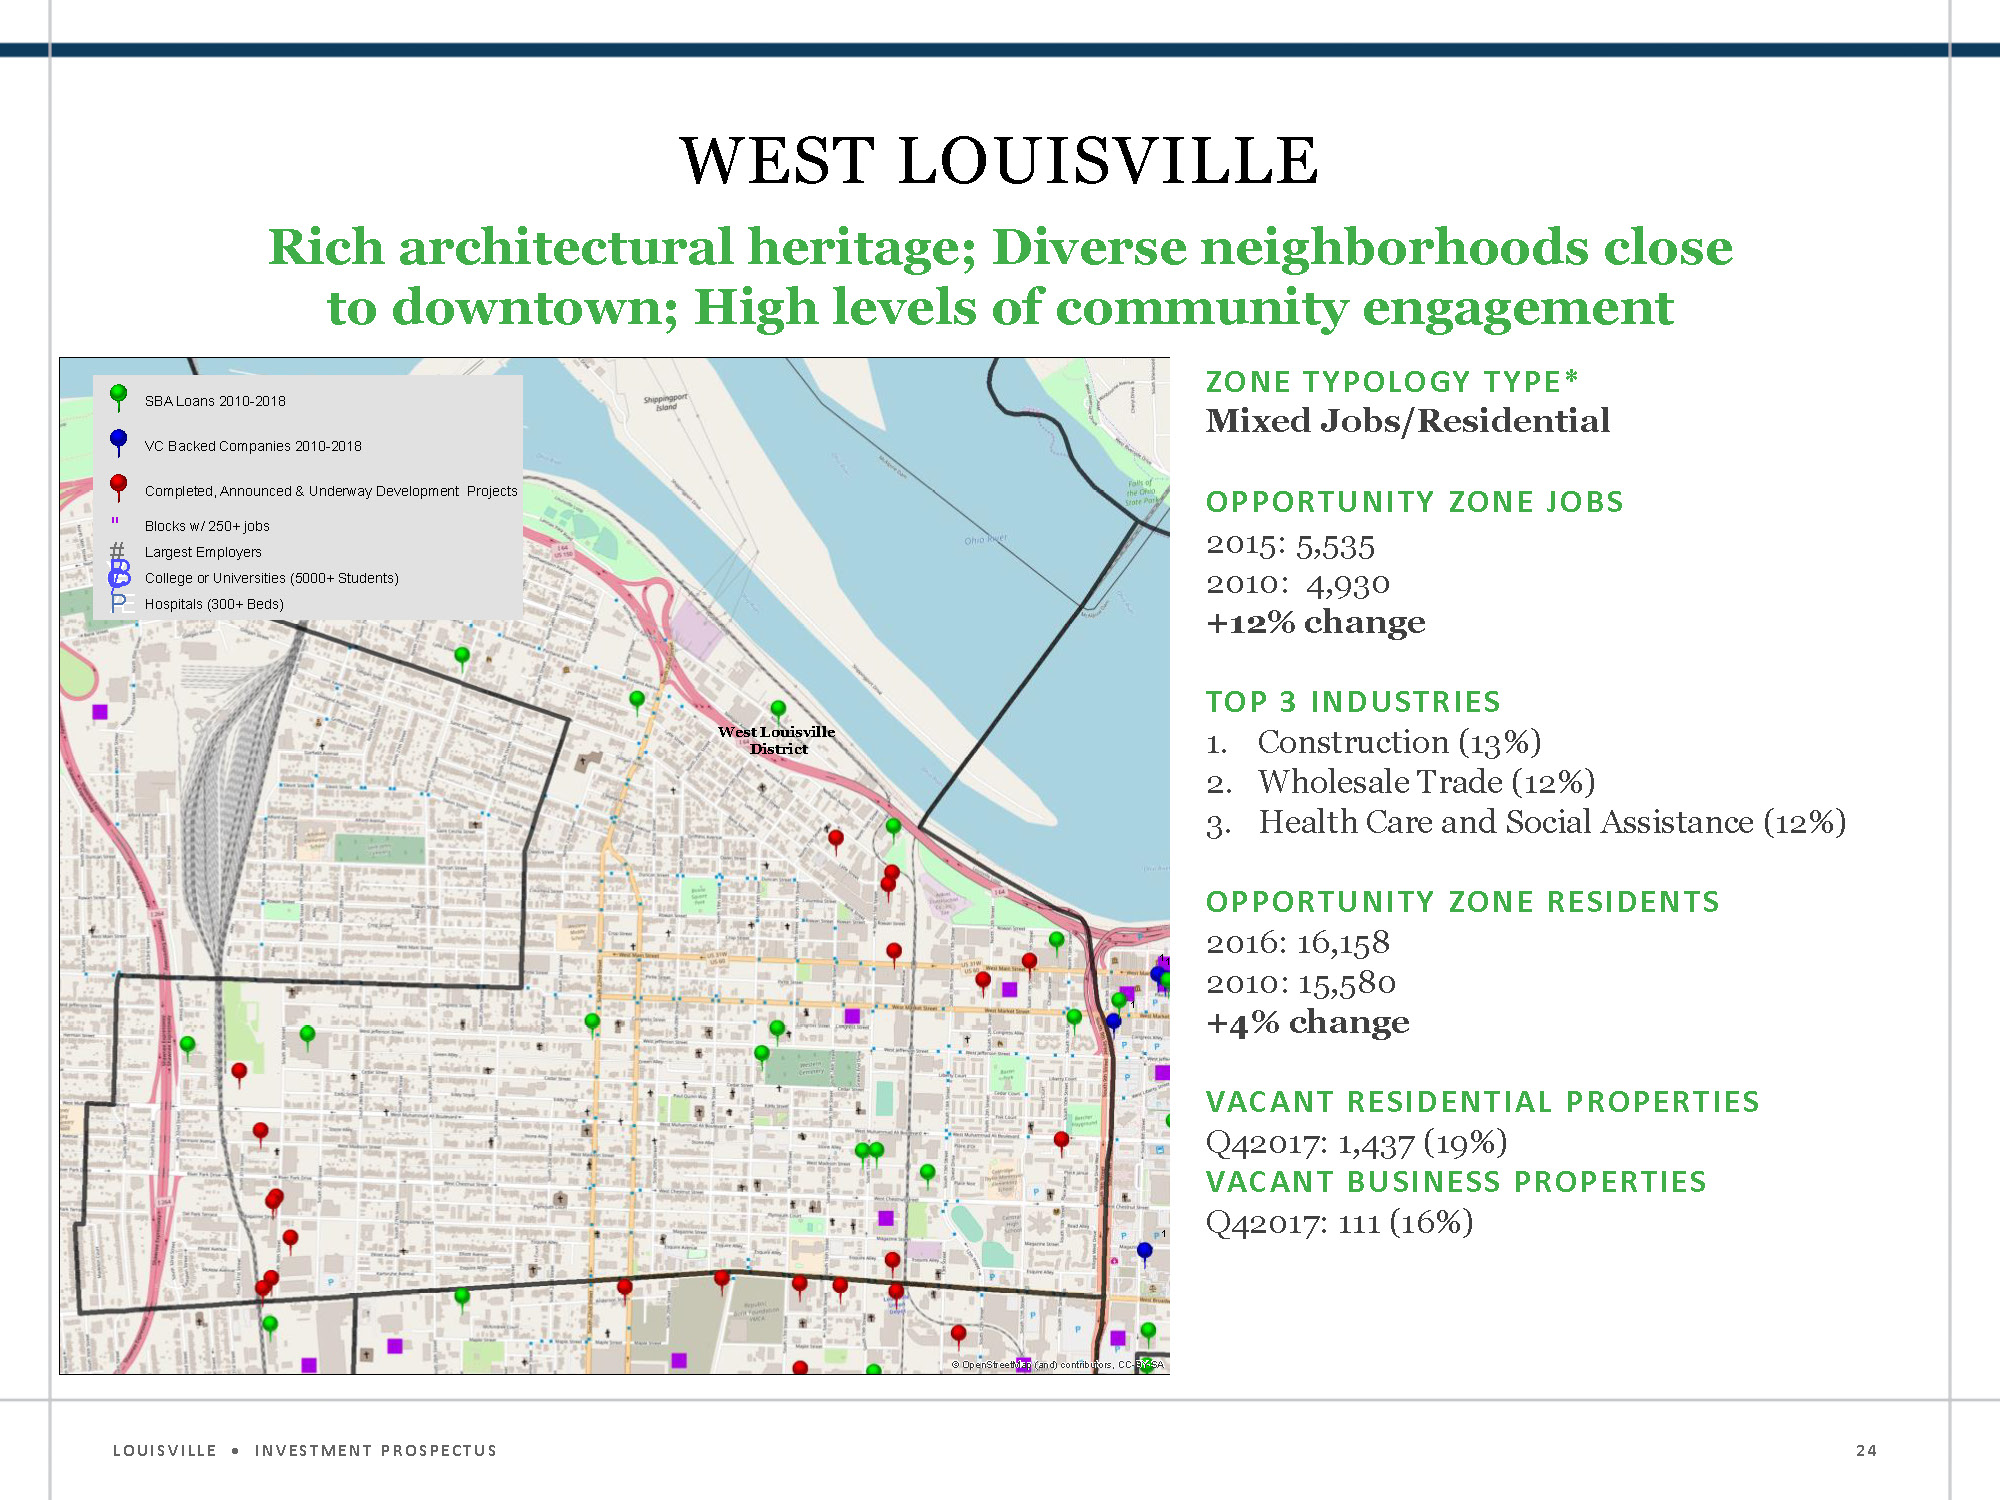
Rich architectural heritage; Diverse neighborhoods close to downtown; High levels of community engagement
Zone Typology Type
Mixed Jobs/Residential
Opportunity Zone Jobs
- 2015: 5,535
- 2010: 4,930
- +12% change
Top 3 Industries
- Construction (13%)
- Wholesale Trade (12%)
- Healthcare and Social Assistance (12%)
Vacant Residential Properties
Q4 2017: 1,437 (19%)
Vacant Business Properties
Q4 2017: 111 (16%)
Example 1: West Louisville
Depicted on the right is a drill-down map for West Louisville. Your map should provide a clear geographic overview of any key assets or investments in the area. This map of West Louisville includes SBA loans, venture capital investment, and city investments. City permit data can also be a good data source for identifying investments.To the right of the map includes a data summary of the area, in this case drawn from the below sources:
Louisville’s prospectus provides background on historic investments and identifies catalytic investment opportunities as defining the potential expressed through the mental map. This includes:
West Louisvile Catalytic Investment: Heritage West
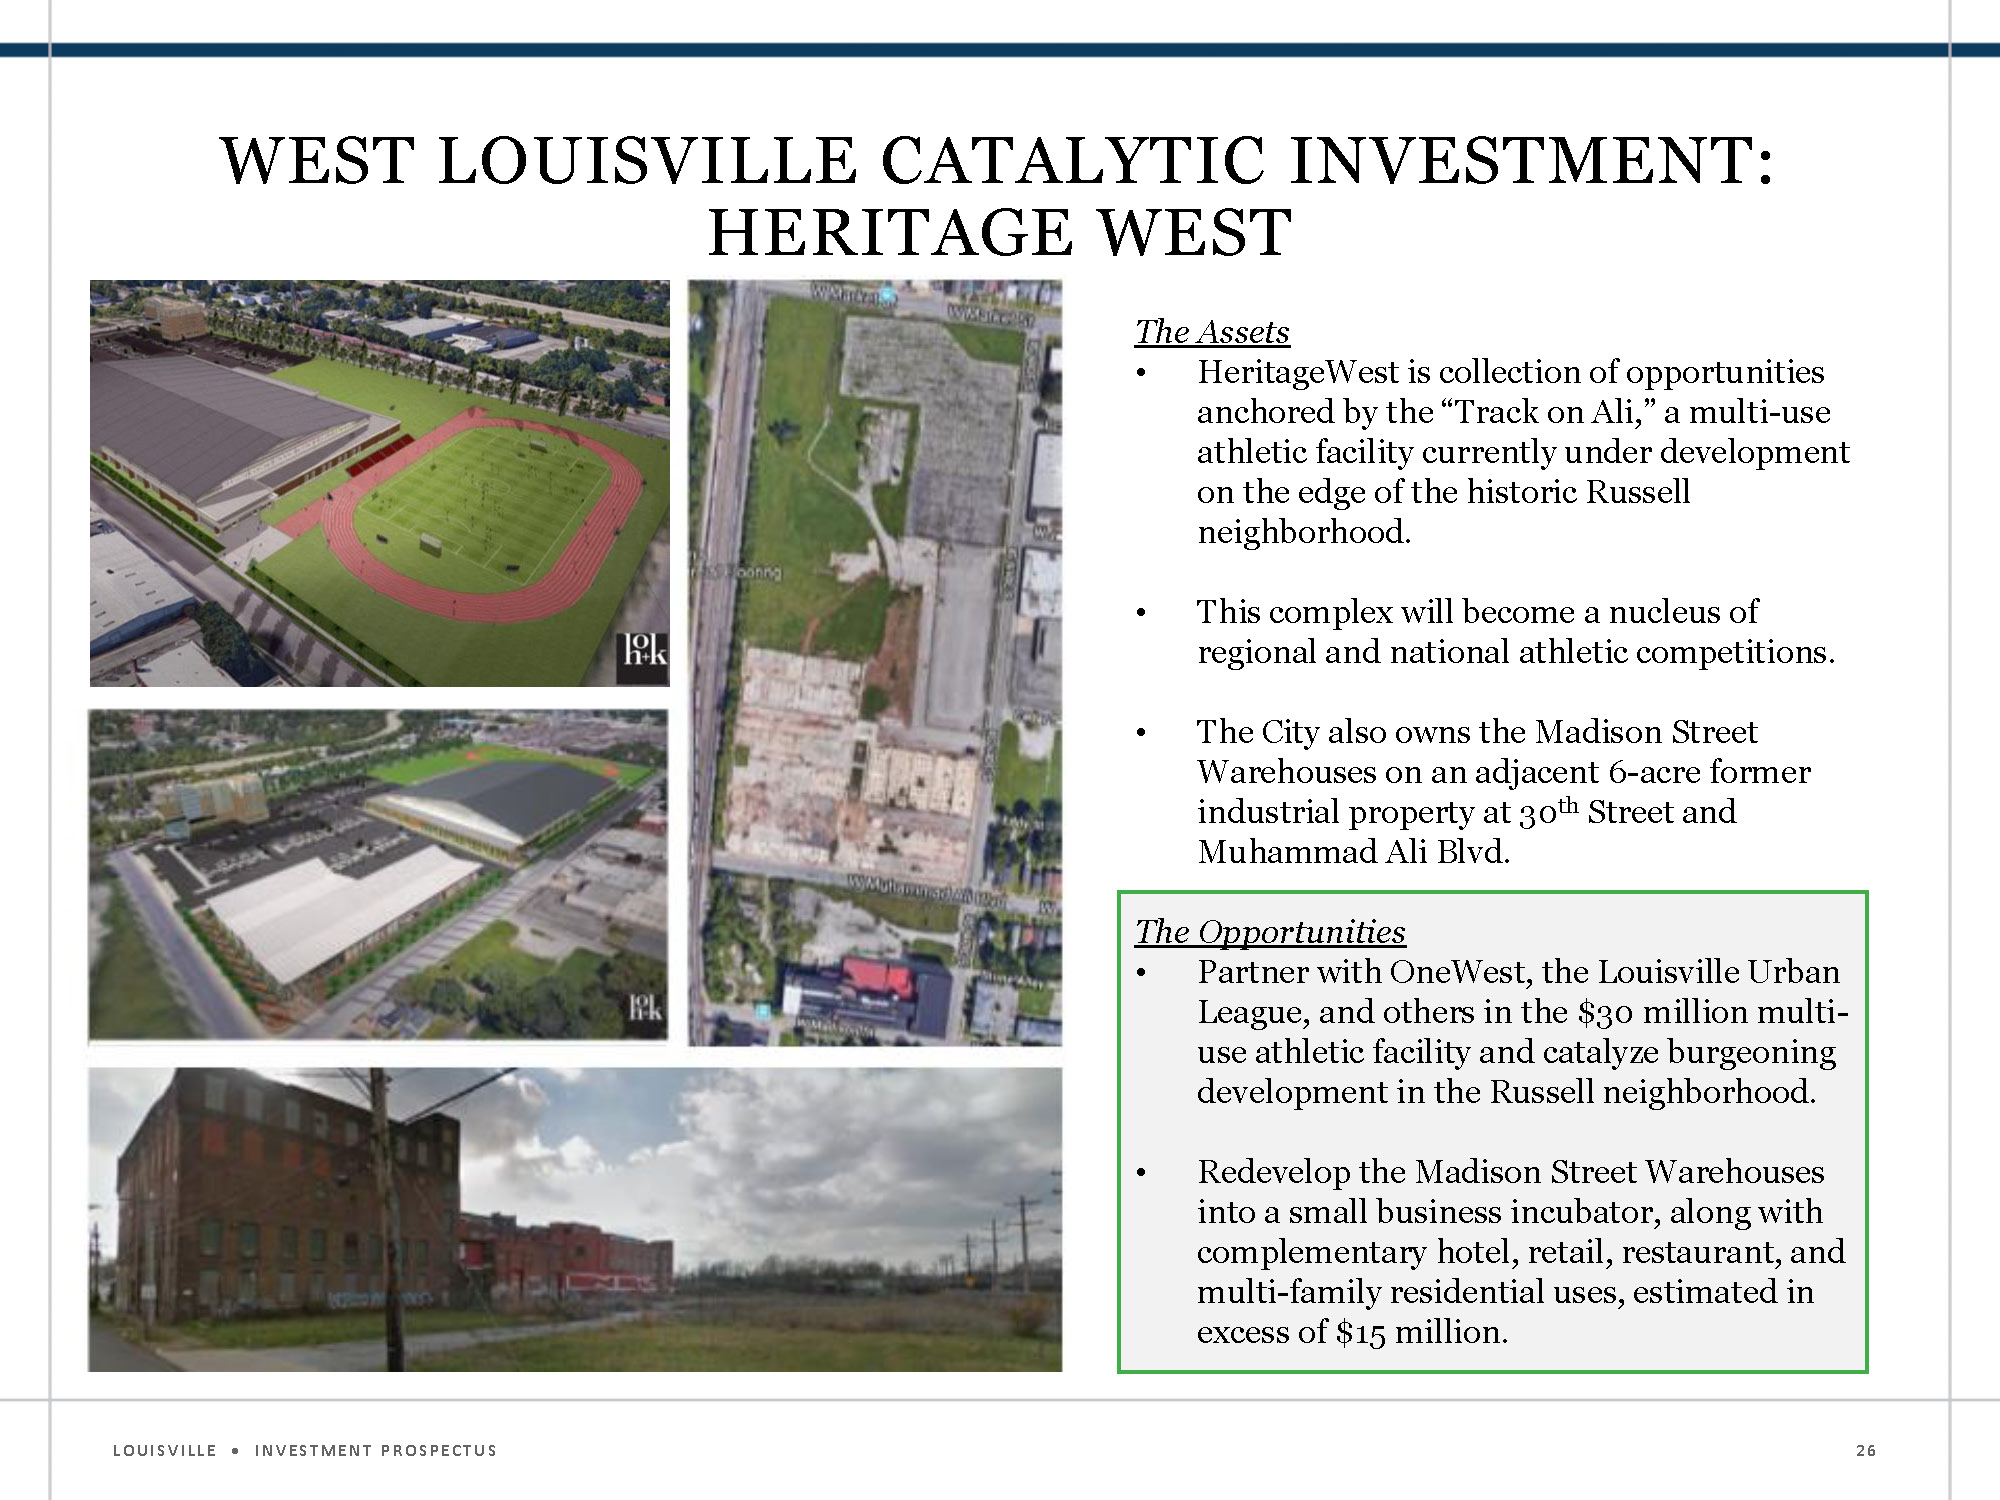
The Assets
- HeritageWest is a collection of Opportunities anchored by the "Track on All," a multi-use athletic facility currently under development on the edge of the historic Russell neighborhood
- This complex will become a nucleus of regional and national athletic competition
- The City also owns the Madison Street Warehouses on the adjacent 6-acre former industrial property at 30th Street and Muhammad Ali Blvd
The Opportunities
- Parner with OneWest, the Louisville Urban League and others in the $30 million multi-use athletic facility and catalyze burgeoning development in the Russell Neighborhood
- Redevelop the Madison Street Warehouses into a small business incubator, along with complementary hotel, retail, restaurant and multi-family residential uses, estimated in excess of $15 million
Historic investments
Describe public, private and civic investments that have already been made in the area and serve as a platform for further investment.
Catalytic investments
Louisville cites a formerly industrial area where a CDC and other civic institutions have bundled assets anchored by an athletic facility and historic structures to create a mixed-use development concept including business incubation, residential and enhanced multi-use athletic facilities. Key for your city is to identify an investable project that is emblematic of Opportunity Zone, is already in design phase and could, if financed and delivered, have a catalytic impact on the Opportunity Zone. Catalytic projects can be sourced from public, private and civic institutions and leaders and should reflect priority areas where cities have aligned institutional and regulatory approvals so project can proceed with an influx of investment.
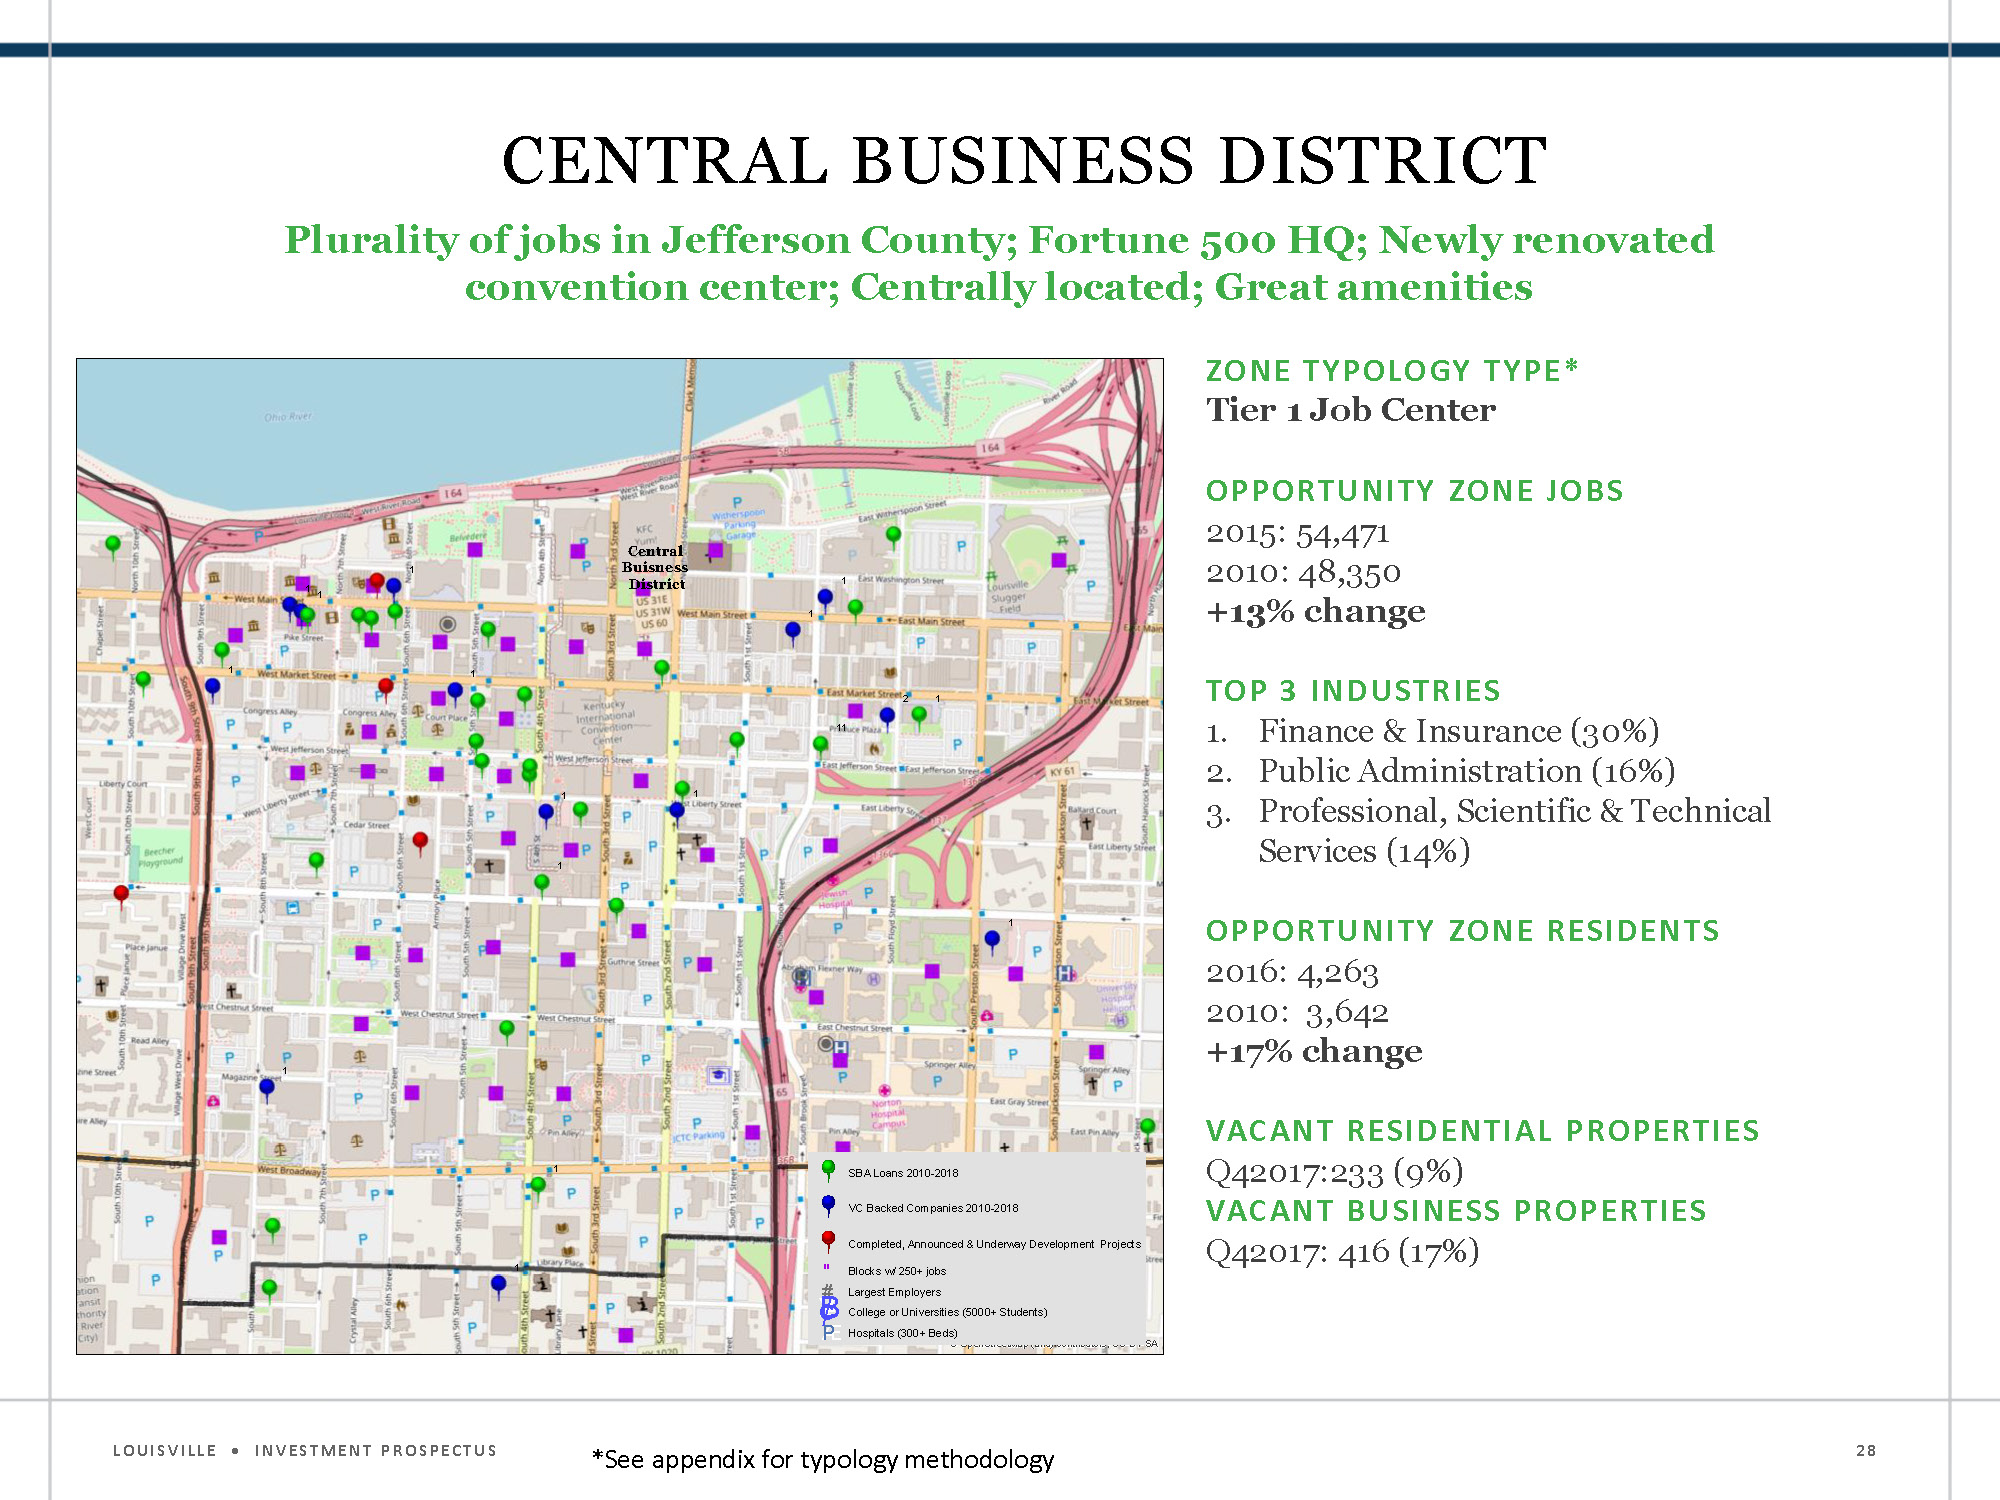
Central Business District
Plurality of jobs in Jefferson County; Fortune 500 HQ; Newly renovated convention center; Centrally located; Great amenities
Zone Typology Type
Tier 1 Job Center
Opportunity Zone Jobs
- 2015: 54,471
- 2010: 48,350
- +13% change
Top 3 Industries
- Finance & Insurance (30%)
- Public Administration (16%)
- Professional, Scientific & Technical Services (14%)
Opportunity Zone Residents
- 2016: 4,263
- 2010: 3,642
- +17% change
Vacant Residential Properties
Q4 2017: 233 (9%)
Q4 2017: 416 (17%)
Example 2: Louisville CBD
On the right is the mental map for the Louisville CBD. As with West Louisville, this map includes SBA loans, venture capital investment, and city investments. City permit data can often be a good data source for identifying investments. As before, the right side includes a data summary of the area using the same data sources.
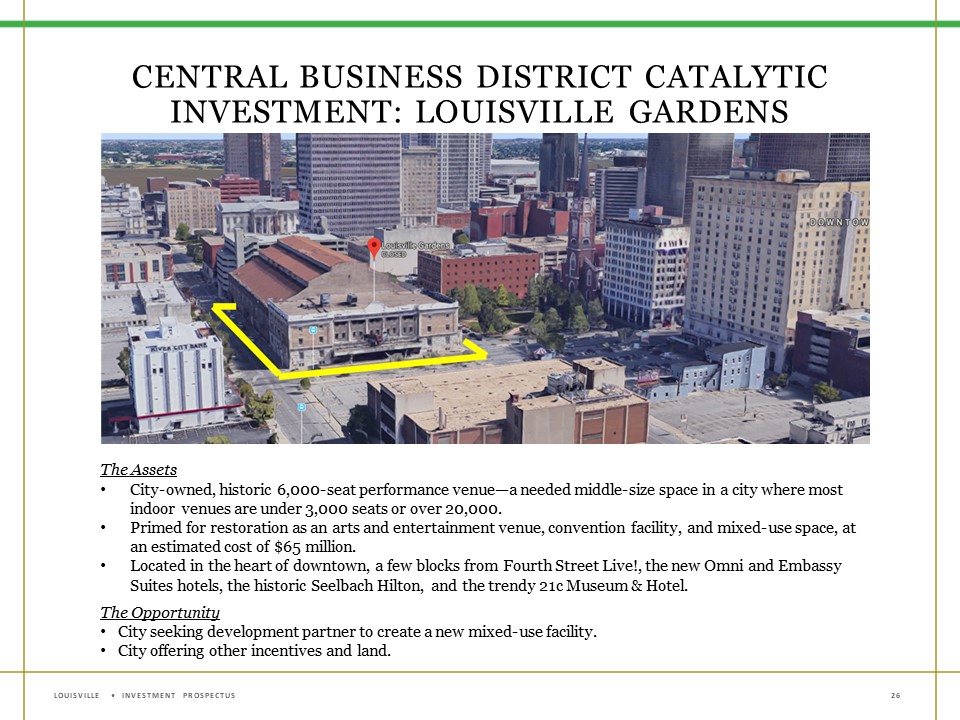
Central Business District Catalytic Investment: Louisville Gardens
The Assets
- City-owned, historic 6,000-seat performance venue - a needed middle-size space in a city where most indoor venues are under 3,000 seats over 20,000
- Primes for restoration as an arts and entertainment venue, convention facility and mixed-use space, at an estimated cost of $65 million
- Located in the heart of downtown, a few blocks from Fourth Street Live!, the new Omni and Embassy Suites hotels, the historic Seelbach Hilton and the trendy 21c Museum & Hotel
The Opportunity
- City seeking development partners to create a new mixed-use facility
- City offering other incentives and land
Catalytic investments
In highlighting its catalytic investment in its Central Business District, Louisville focused on cultural assets ripe for rehabilitation and the connectivity of its position related to strengthening housing and job markets. The prospectus showcases its potential position within the market and incentives available for this parcel.