Anti-Racism Demographic Dashboards
The Anti-Racism Demographic Dashboards reflect the access, achievement and representation opportunities on which Drexel's 2020 Anti-Racism Task Force based their recommendations for the University.
The interactive dashboards present snapshots of the Drexel population by race/ethnicity on November 1 each year, during the five-year period between 2018-2022. They convey racial demographic trends and breakdowns among undergraduate and graduate students, faculty and professional staff. To create these charts, data were compiled directly from Banner/Hyperion totaling more than 100 percent for each group, which aligns more closely with how people identify their race/ethnicity. For example, if someone enters Hispanic for ethnicity and Black, Asian, and White for race, they will be reflected in all four categories on the dashboard, instead of a default of Hispanic for ethnicity and “two or more races” for race.
We will continue to build out the dashboards with more data for the University to use as a reference and accountability measure, as we review and monitor the progress of the implementation plans developed to advance Drexel’s journey towards anti-racism.
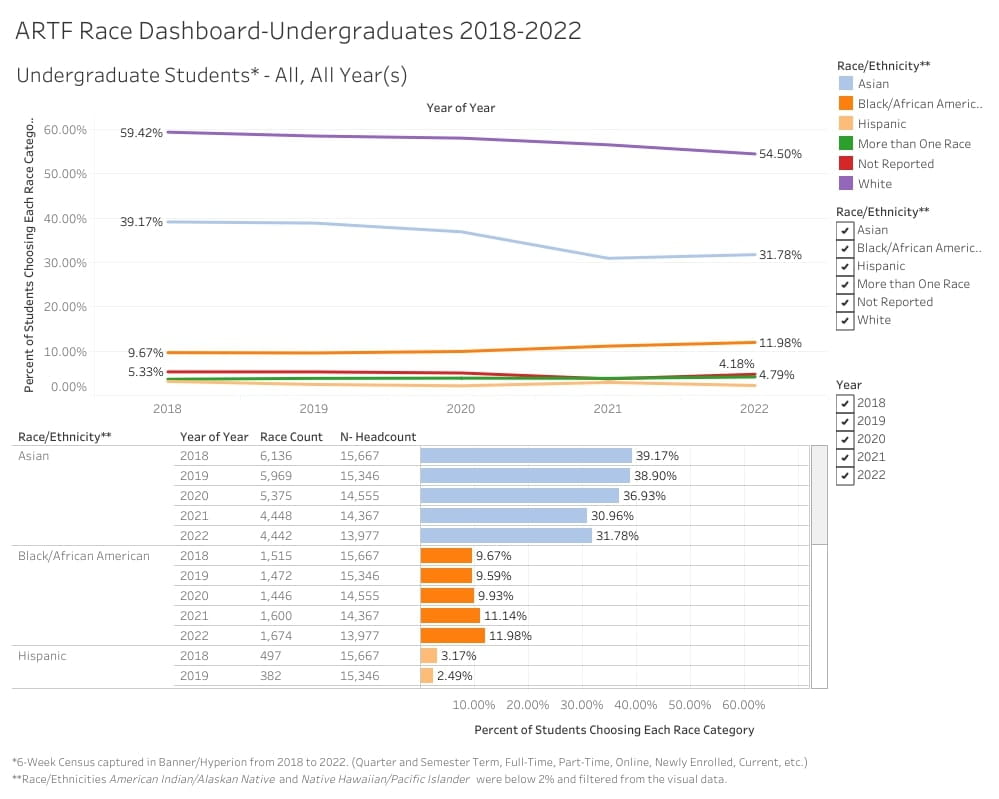
Undergraduates (2018-2022)
The demographic representation of Black/African American undergraduate students increased about 2.3 percentage points from 9.7 percent in 2018 to 11.98 percent in 2022.
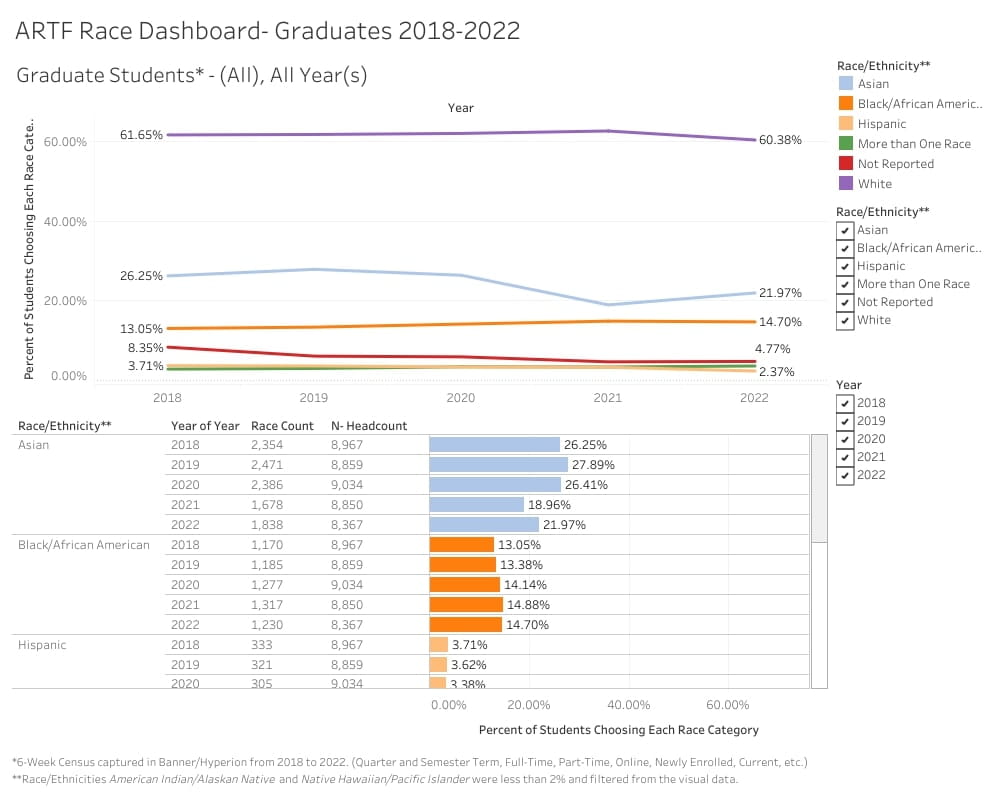
Graduates (2018-2022)
The graduate student dashboard shows that the representation of Black/African American graduate students increased about 1.7 percentage points from 13.0 percent to 14.7 percent between 2018 and 2022.
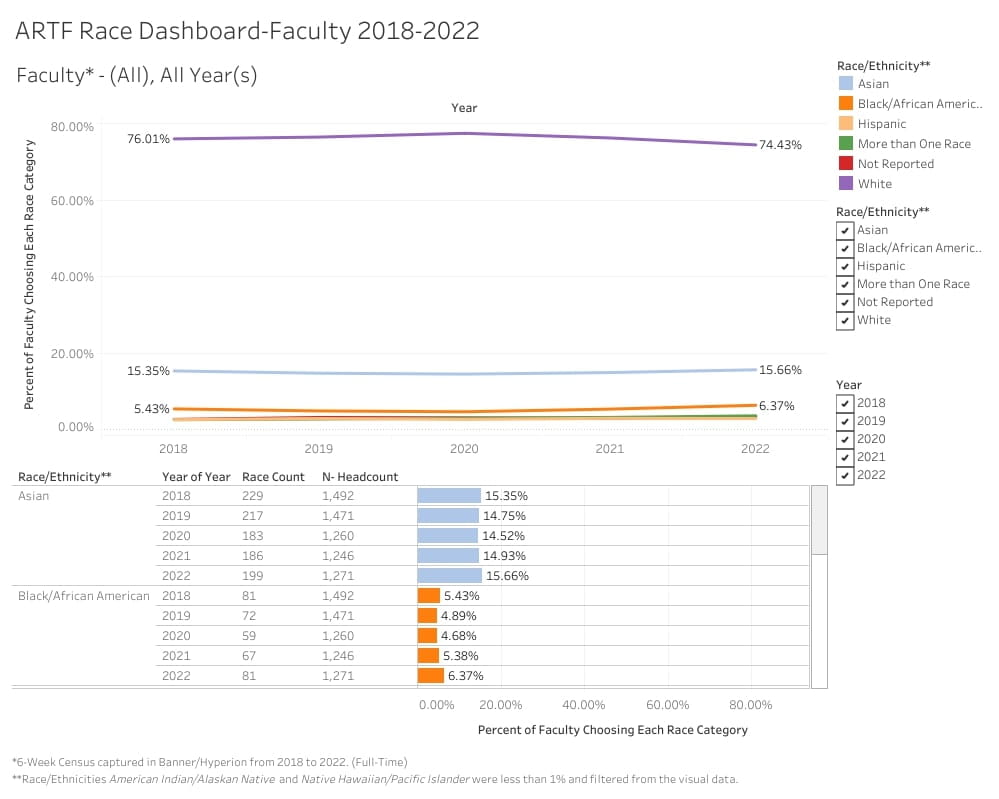
Full-time Faculty (2018-2022)
The representation of Black/African American full-time faculty at Drexel increased 1 percentage point from 5.4 to 6.4 percent, as shown in the full-time faculty dashboard.
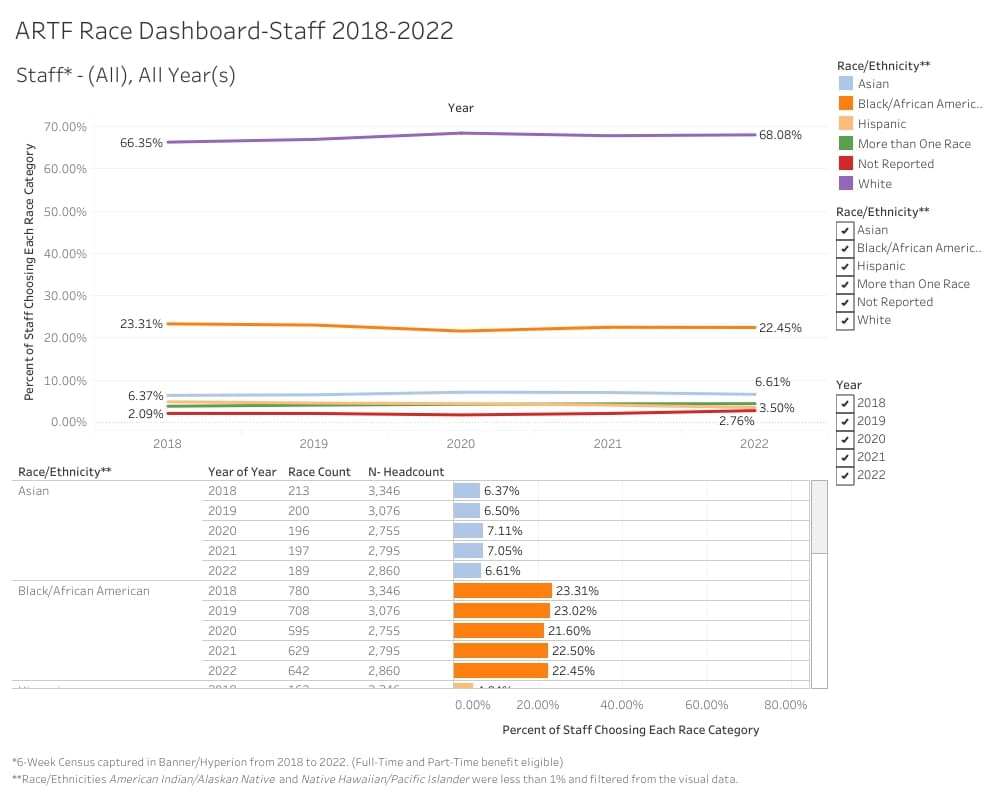
Benefits-Eligible Staff (2018-2022)
The benefits-eligible staff dashboard displays that the representation of Black/African American benefits-eligible staff decreased about a 1 percentage point from 23.3 percent in 2018 to 22.4 percent in 2022.